One of my favorite joys is exploring a city late at night on rollerblades. I’ve been doing it fairly regularly for about 10 years now, first in Boston and then in NYC. Every time day turns to night and back again a city takes a breath. At night people flow out or huddle up in buildings, leaving the streets clear for the people and machines that reset the urban environment for the next day. Garbage trucks lumber about, workers unload fresh stock at stores, repairs happen in subway tunnels and on roads. Without all the people it’s easier to see the naked form of the streets, buildings, and infrastructure.
When you’re moving slow you spend more time taking in the details. When you’re moving fast the world becomes a blur. The world around you is a brush that paints into your perception, and the speed of the brush strokes helps set the style of the painting. I like rollerblading in particular because it gives those perceptual brush strokes a lot of range. You can quickly stop and soak in a detail, change direction, occupy a tight space, or fly downhill in a long straight line.
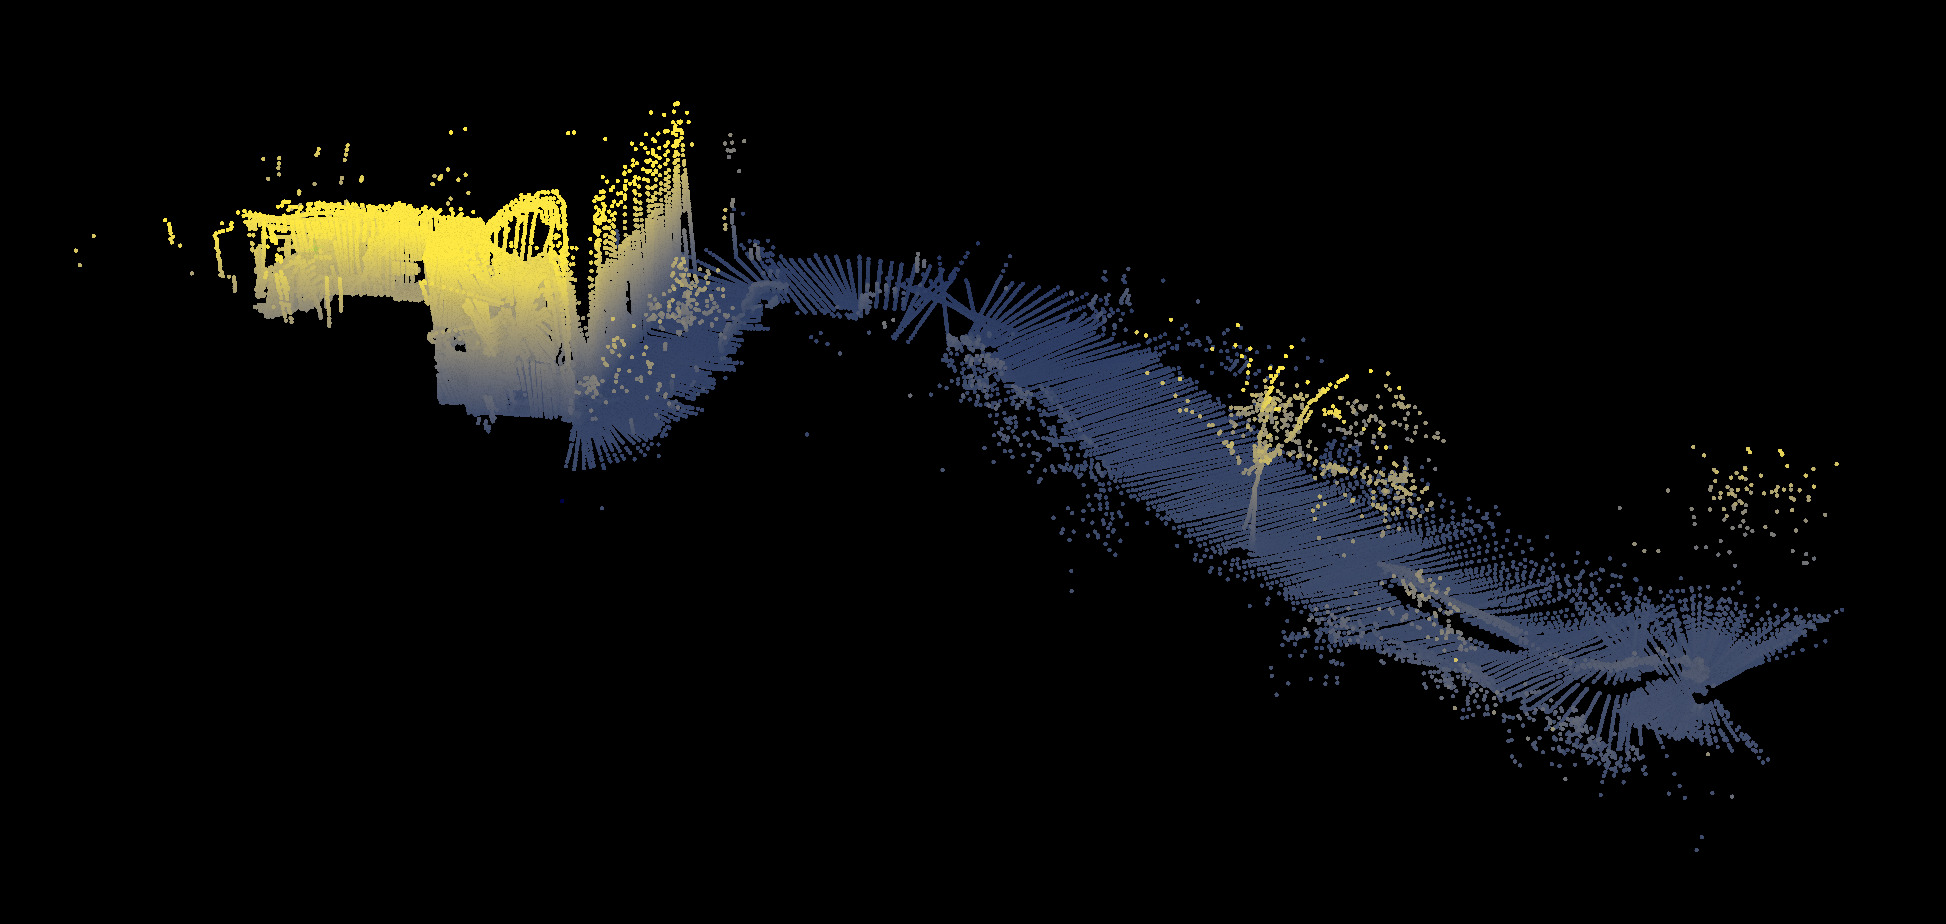
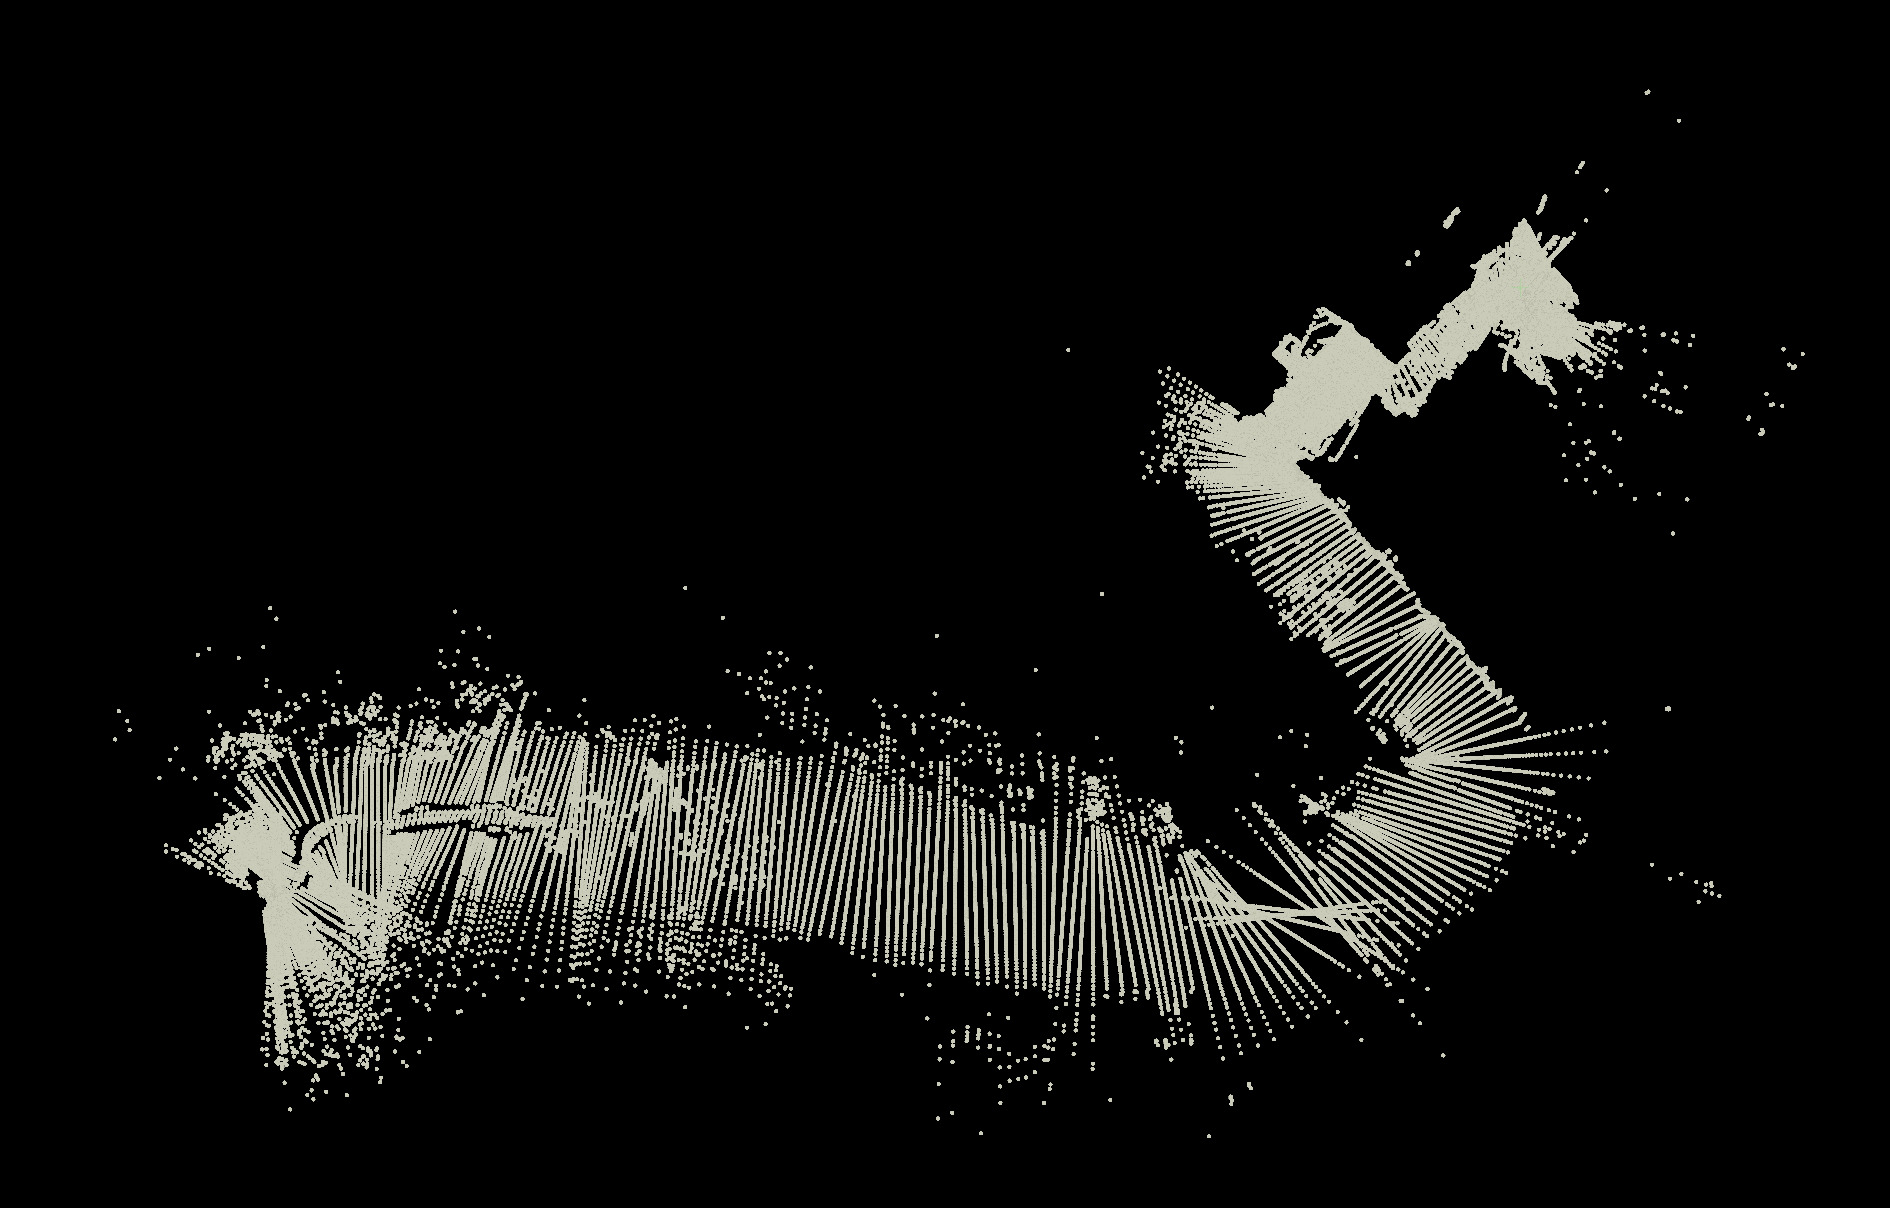
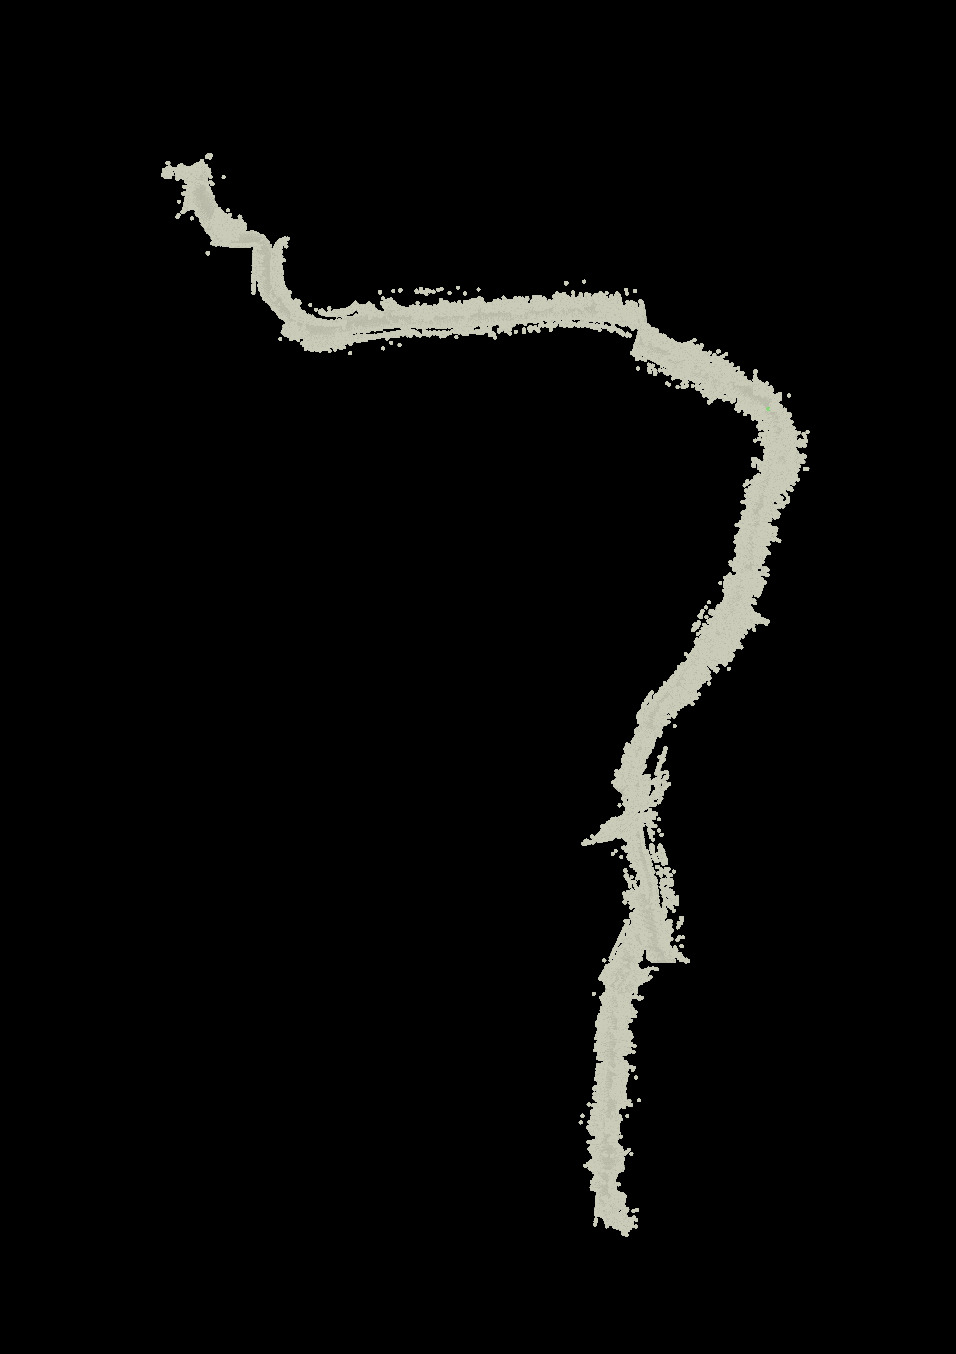
Some years ago I picked up a 2D LiDAR scanner (RPLidar A1) without a particular purpose in mind. As it spins it tells you its current angle and the distance to the environment in the direction it’s pointing. They’re often used in robot vacuums to map walls and other obstacles. One night in 2021 I put it on the end of a stick and carried it around with my laptop recording timestamped measurements from it. By putting each scan sweep on its own layer I could make visualizations like this:
Taken outside my apartment at the time during heavy snowfall. You can see the path cut through the snow on the sidewalk, the apartment building wall, windows, cars along the sidewalk, and points on a tree.
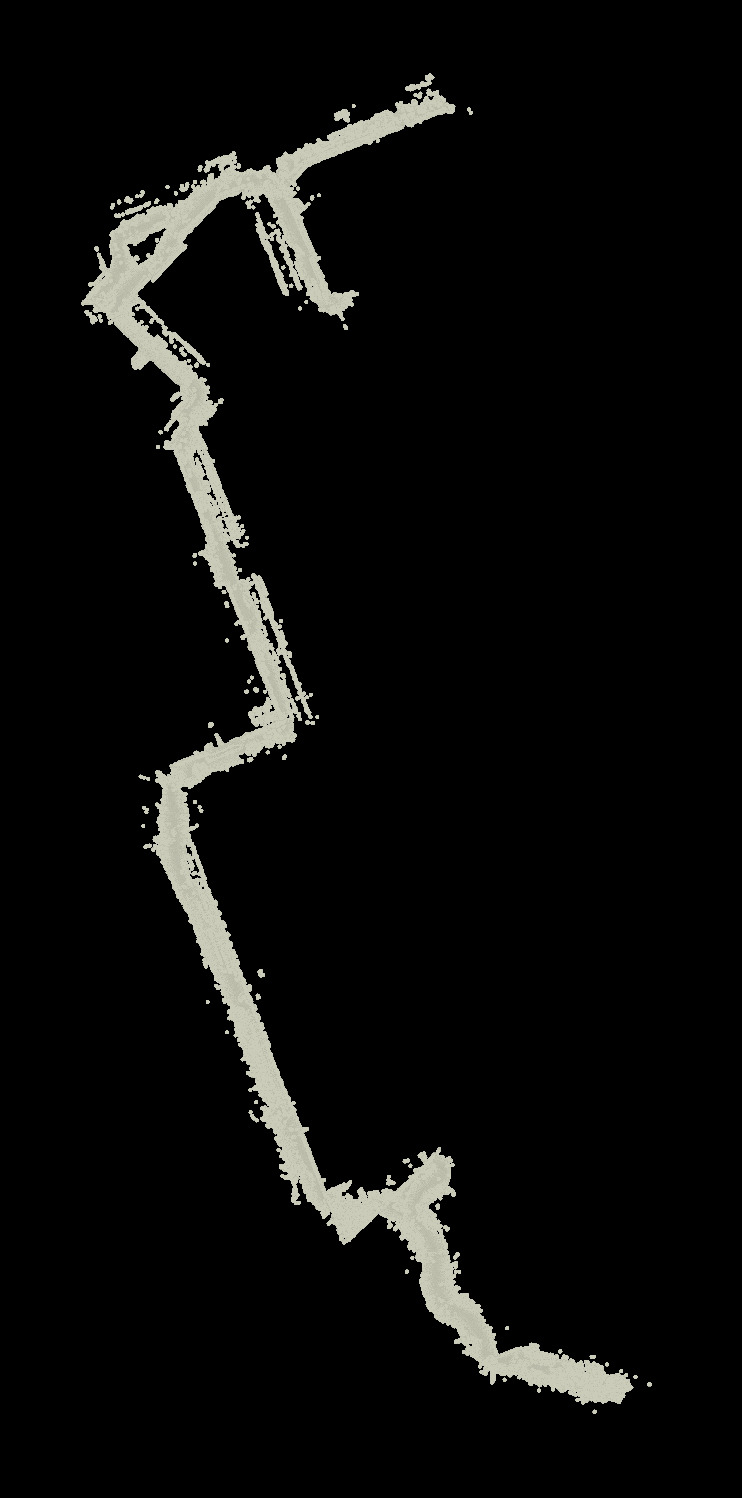
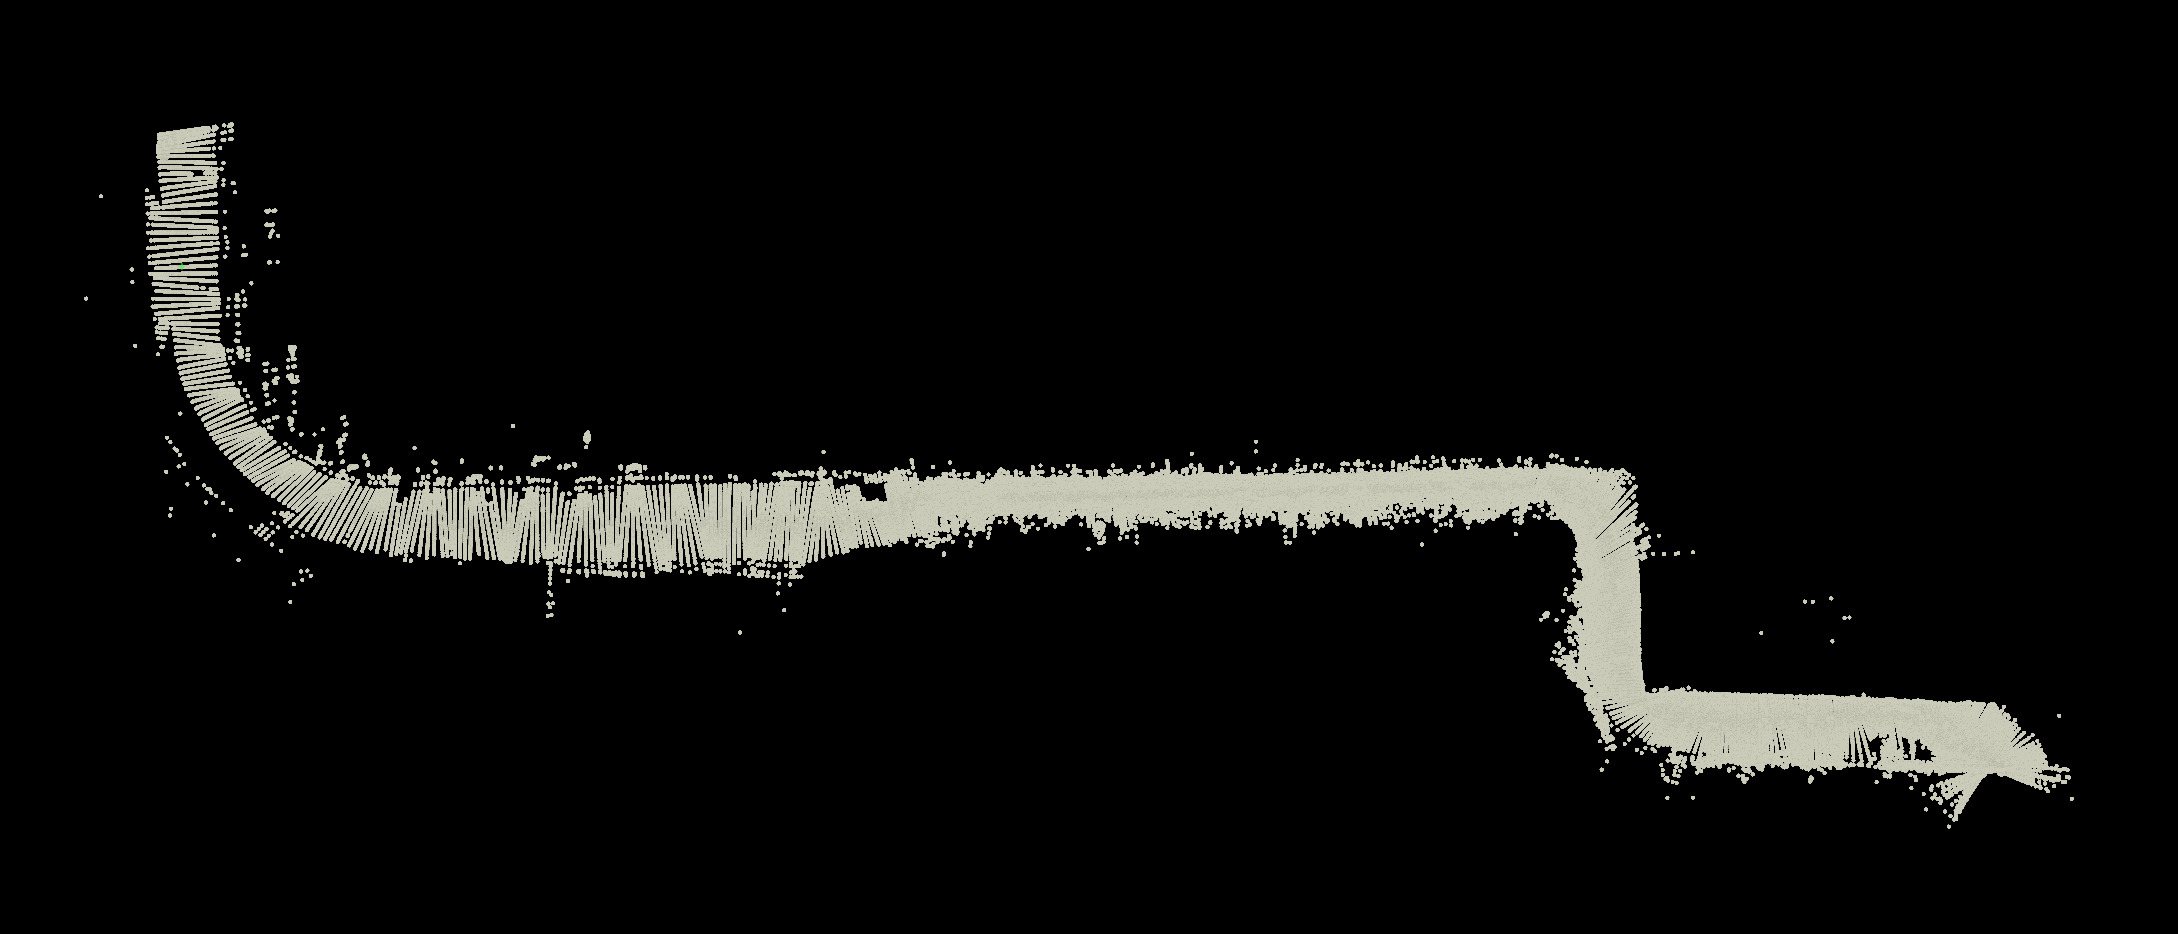
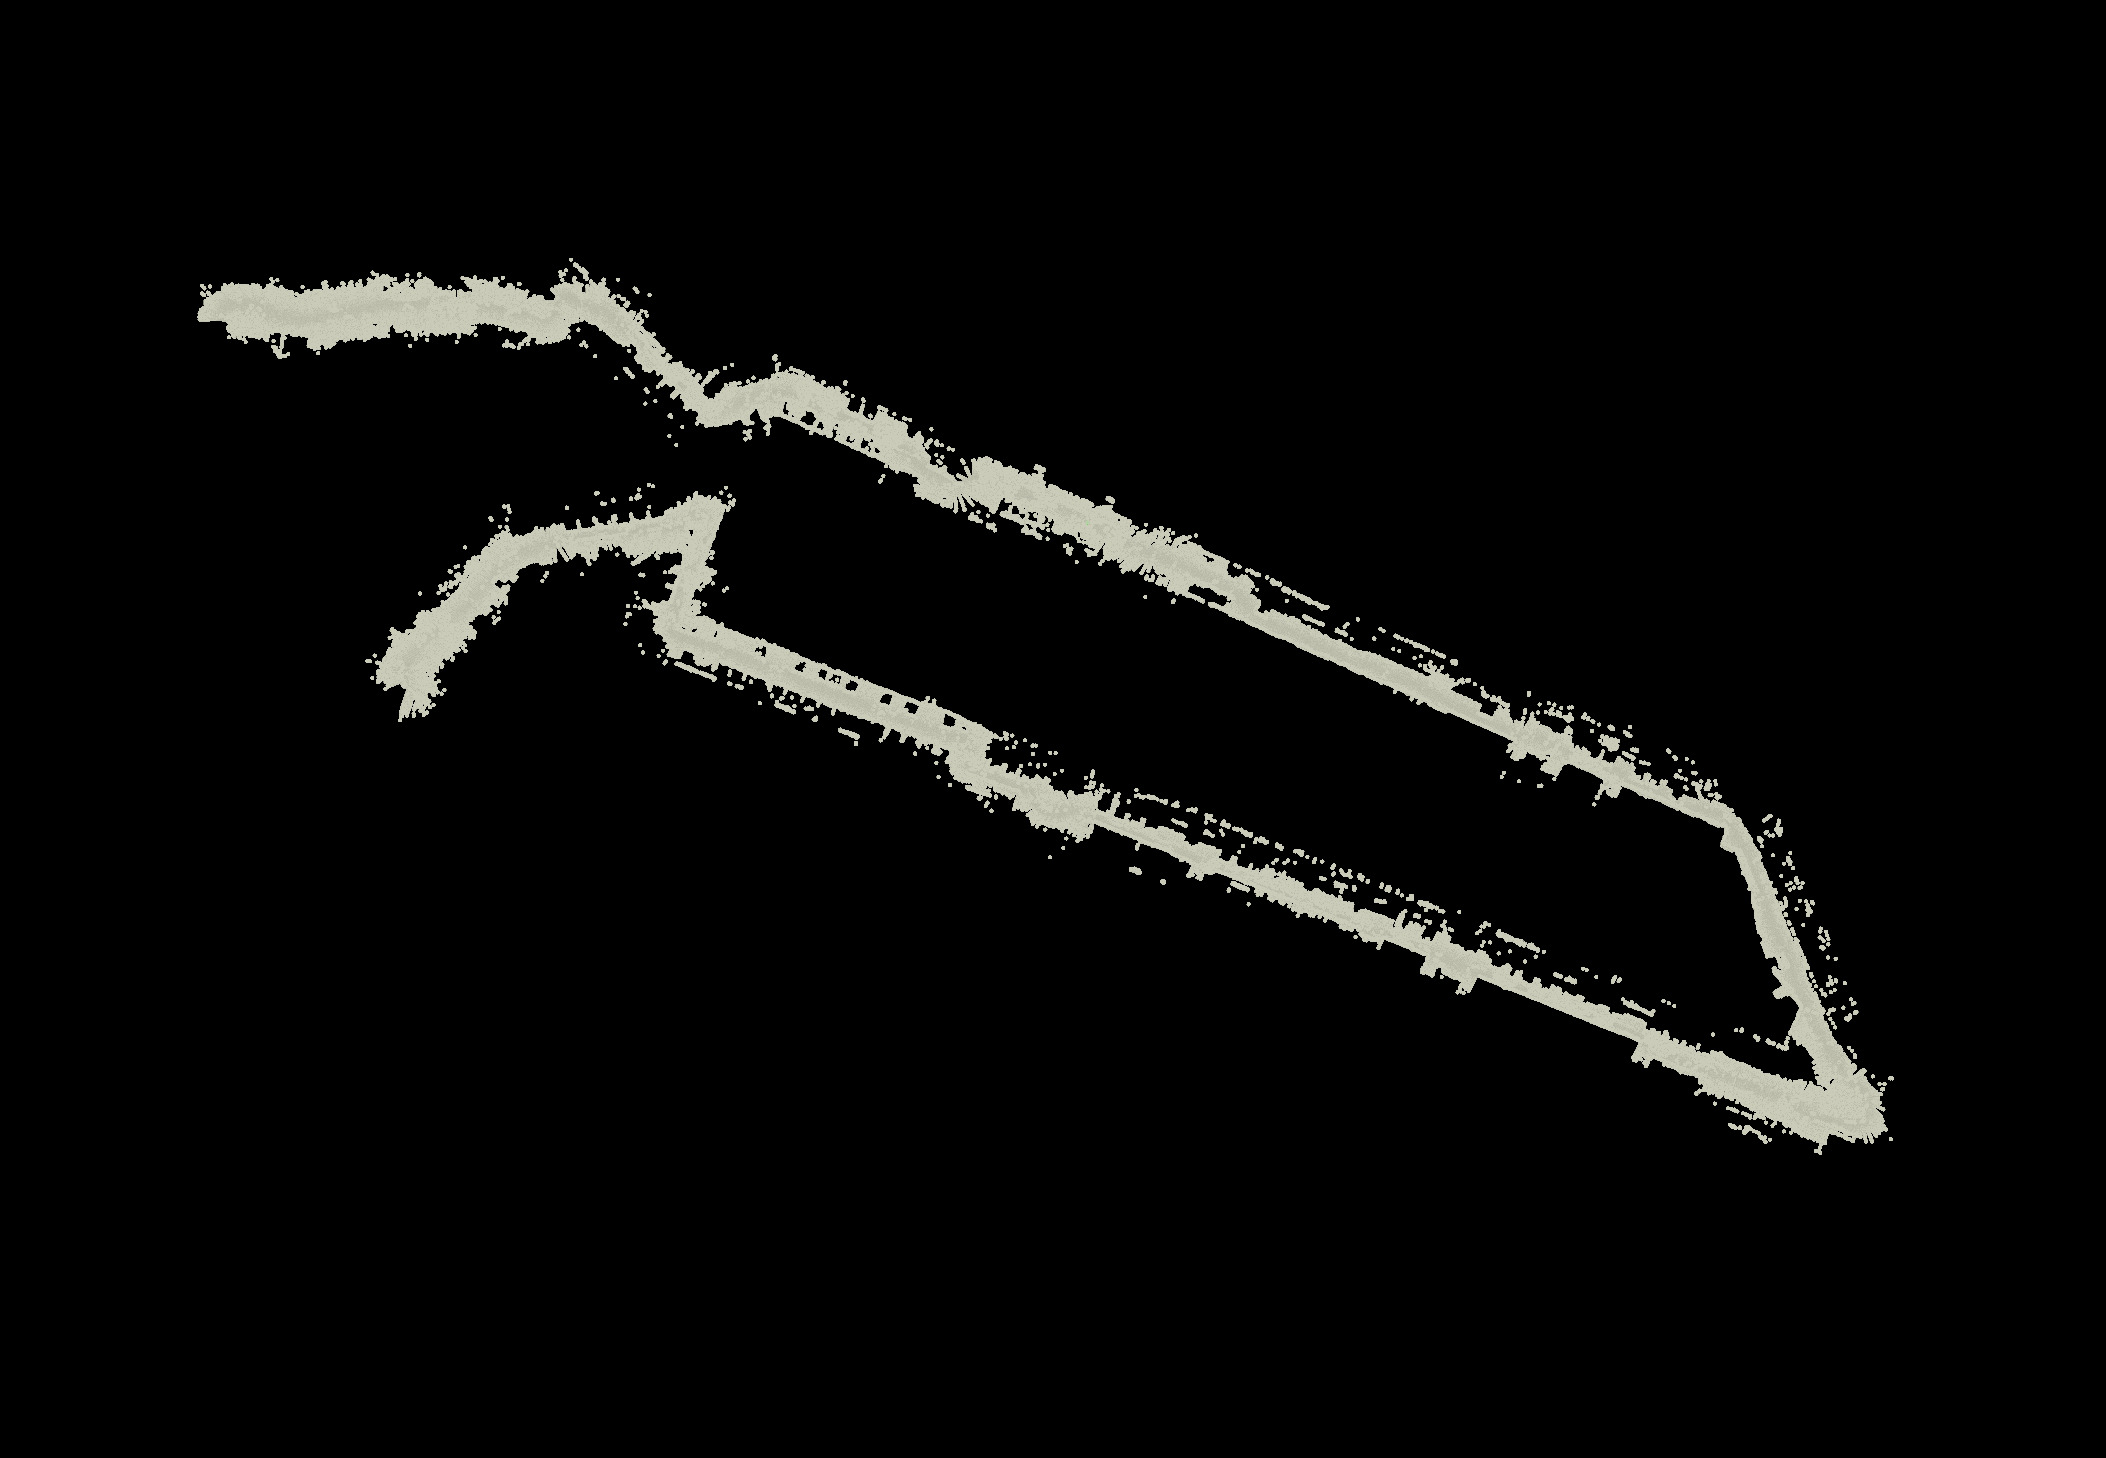
 Walking along the perimeter wall outside New Lab. Just behind the character is scaffolding. There are rectangles from
windows. And if I remember right there was snow on the ground at that time too. This one is much more distorted because
I wasn’t so careful to keep the sensor stable while moving.
Walking along the perimeter wall outside New Lab. Just behind the character is scaffolding. There are rectangles from
windows. And if I remember right there was snow on the ground at that time too. This one is much more distorted because
I wasn’t so careful to keep the sensor stable while moving.
I think about devices like this as “weird cameras” - imperfect leaky imaging systems that don’t faithfully reproduce a precise representation of what they are pointed at. Instead they mix in side channels that the user or environment can affect, and that frees them up for more interesting creative expression.
While I was experimenting with the stickdar I had the idea that it would be fun to make maps on a larger scale by carrying it around while I was rollerblading. But when I tried that out the maps were very chaotic because it was harder to keep it steady. I moved onto other projects, but then the other week this project thread popped back into mind.
Over the years I’ve done various projects which needed 6 DoF tracking through space (i.e. machine needs to know where it is and where it is pointing). A very convenient way to achieve this nowadays for something quick and dirty is to use mobile phones, because they come with AR frameworks that know how to use the sensors and cameras onboard to do very good “inside-out” (no external sensors) 6 DoF tracking. On Android that’s even exposed to web browsers via the WebXR API so you can bash together a web app to access that data, no app development required (hot tip: works on the Quest VR headsets too, including hand tracking, which I’ve had fun using for projects in the past).
So when the stickdar popped back into mind I started thinking about attaching the LiDAR to a phone to track its position and orientation in space. Then I could work out the position of all the points returned by the sensor in 3D world space, building up a point cloud map of the world as I moved through it. In general doing this is a problem known as simultaneous localization and mapping (SLAM), and nowadays there are plenty of very good ways to solve it. But in the spirit of weird cameras, because I was curious about how well this would work, and for fun I decided to try it this way.
Here’s what I came up with:
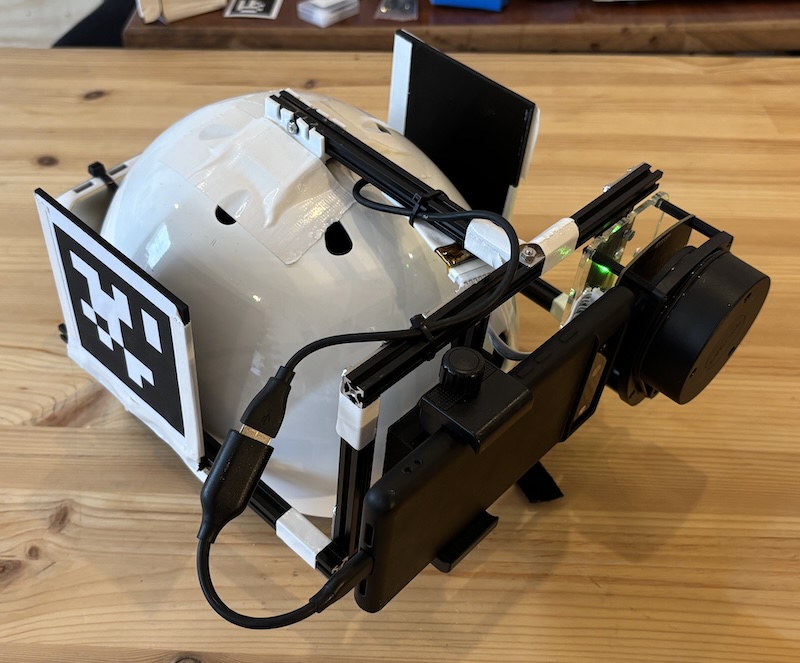
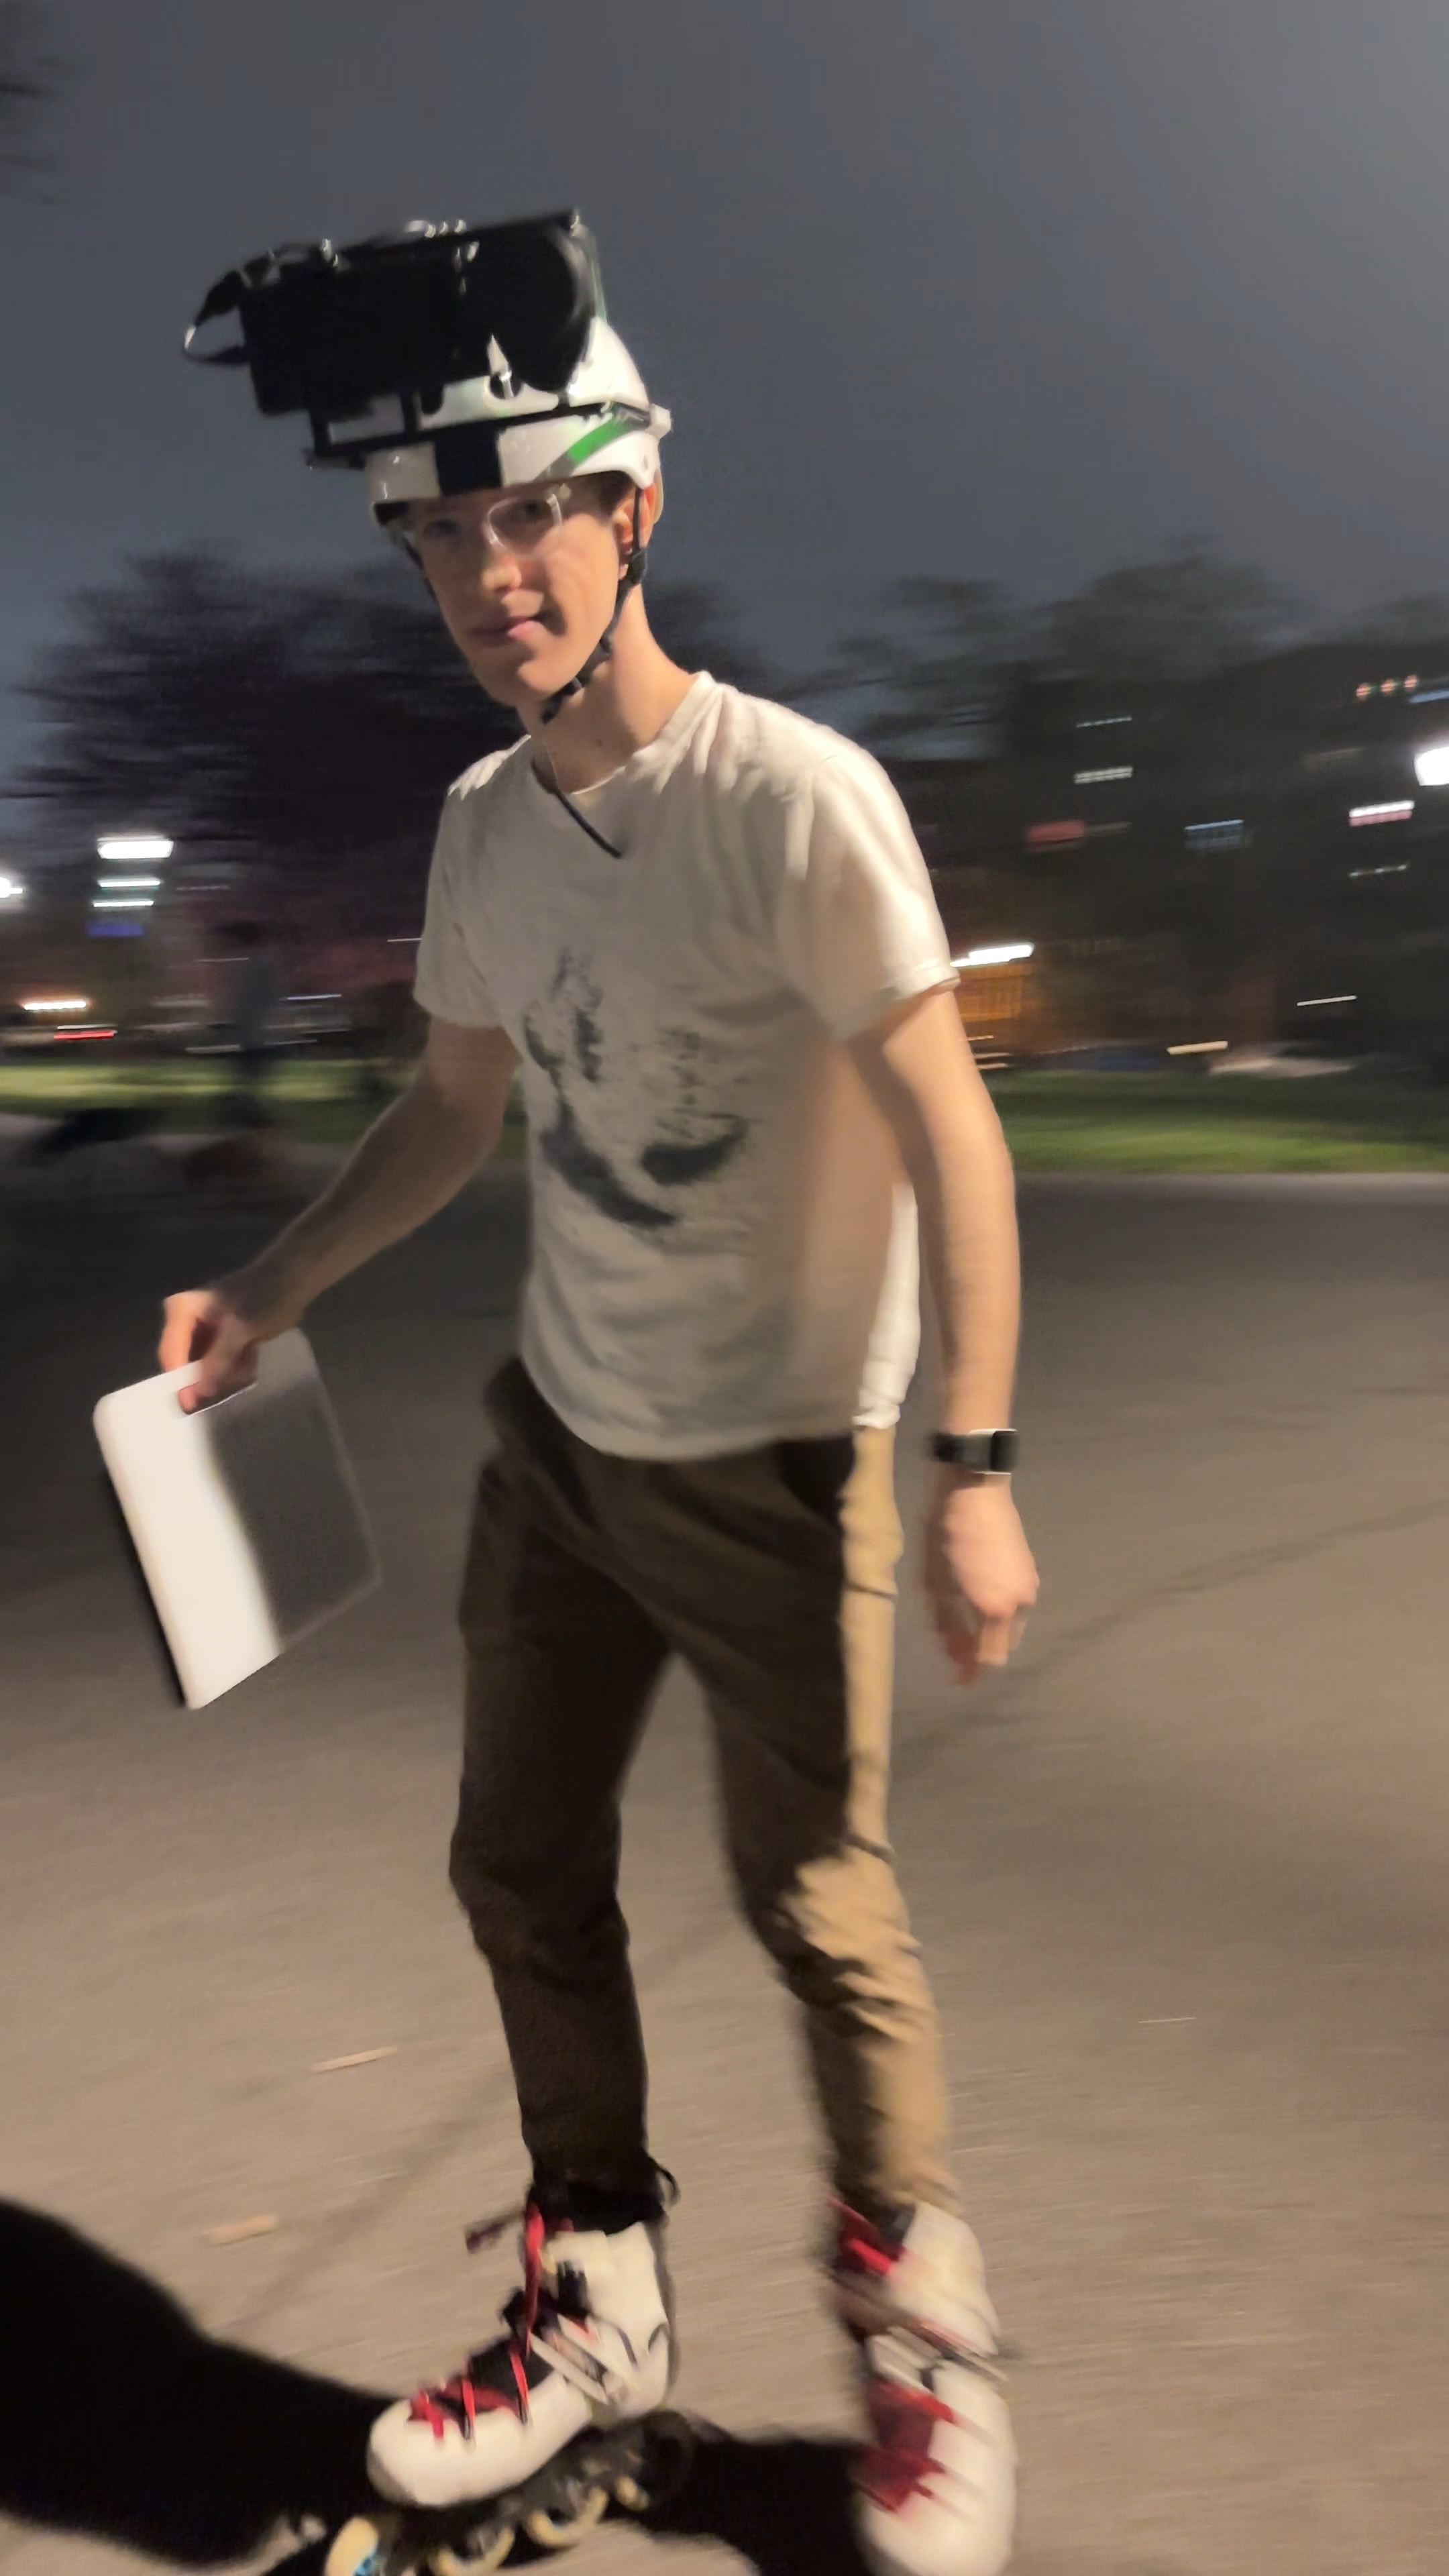
I built a frame out of aluminum extrusion and attached the phone (a Pixel 6) and the LiDAR to the front with some laser cut and 3D printed brackets. I affixed this to the helmet using flexible brackets printed in TPU and VHB double-stick tape, with some white duct tape for insurance. The LiDAR plugs into the phone’s USB-C jack via a USB-to-serial adapter for data and power. The squares on the side are AprilTags, which are visual tracking markers that I wanted to try using for tracking the helmet in space to do some VFX experiments. They’re unrelated to the mapping. The whole thing felt surprisingly sturdy but was pretty front-heavy so I added a power bank on the back purely as a counterweight.
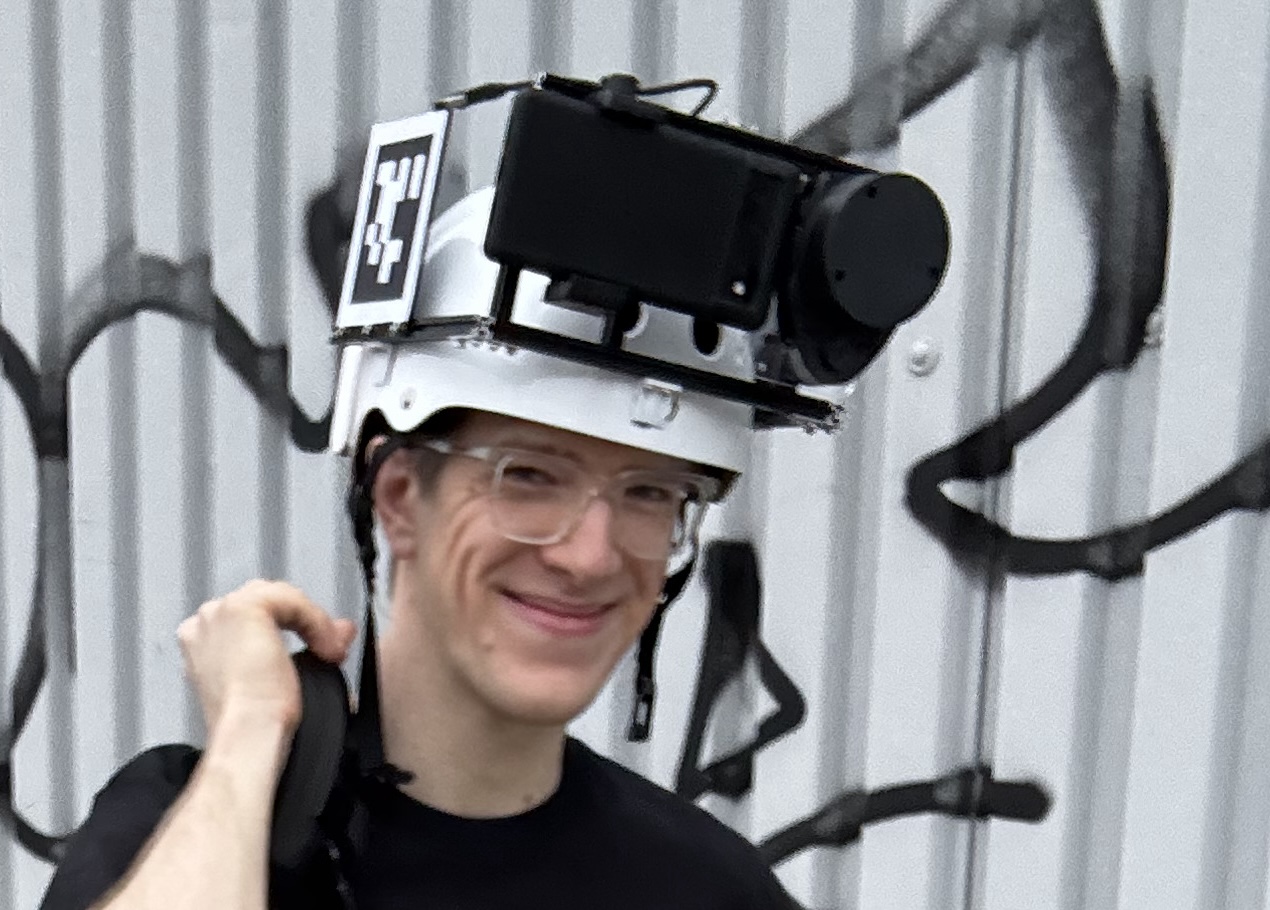
(Photo credit: Sally)
On the software side, I wrote an Android app that implements a driver for the LiDAR. This wasn’t a big challenge because of this nice usb-serial-for-android library and an existing python library I used as reference which implements the simple serial protocol that the LiDAR uses. The app also set up ARCore to provide the 6 DoF tracking data. I made a rudimentary UI which showed the latest scan as an outline overlaid on a 3D AR scene showing the tracking results from ARCore (mainly any detected planes, which I used to check if the tracking was working before starting scans). There is one toggle button which starts and stops captures.
While a capture is happening the data from the LiDAR is being decoded and paired up with 6 DoF poses from ARCore, then appended to a binary log file. So while using it I just needed to hold the helmet, check that I see some planes being detected in the camera image so I know the tracking is working, hit the capture button, and then put it on my head and go! When I finished a scan I’d take the helmet off my head and hit the stop button. Then later I could grab the log files off the phone and visualize them however I liked.
I didn’t want to wait until I got back home to check on how the scans were turning out and I didn’t want to carry my main laptop in a backpack while rollerblading around for fear of smashing it so I took a very cheap laptop and bolted it to an IKEA cutting board that I routed a handle into. I wrote a quick web app for decoding the scan data and displaying it in 3D using Three.js. When I wanted to check on the latest scan I just sat down, plugged the phone into the laptop, and loaded it up in this web app. That ended up working great, and it was surprisingly fun to have the weight of the laptop to swing around while rollerblading.
(Photo credit: Sally)
I didn’t know what to expect from the scans. I have only used ARCore on scales up to maybe a few 10s of meters. So I thought maybe it would lose tracking entirely after I went far enough, or the scans would be very distorted as they got bigger. But I was very pleasantly surprised when I started looking at the results.
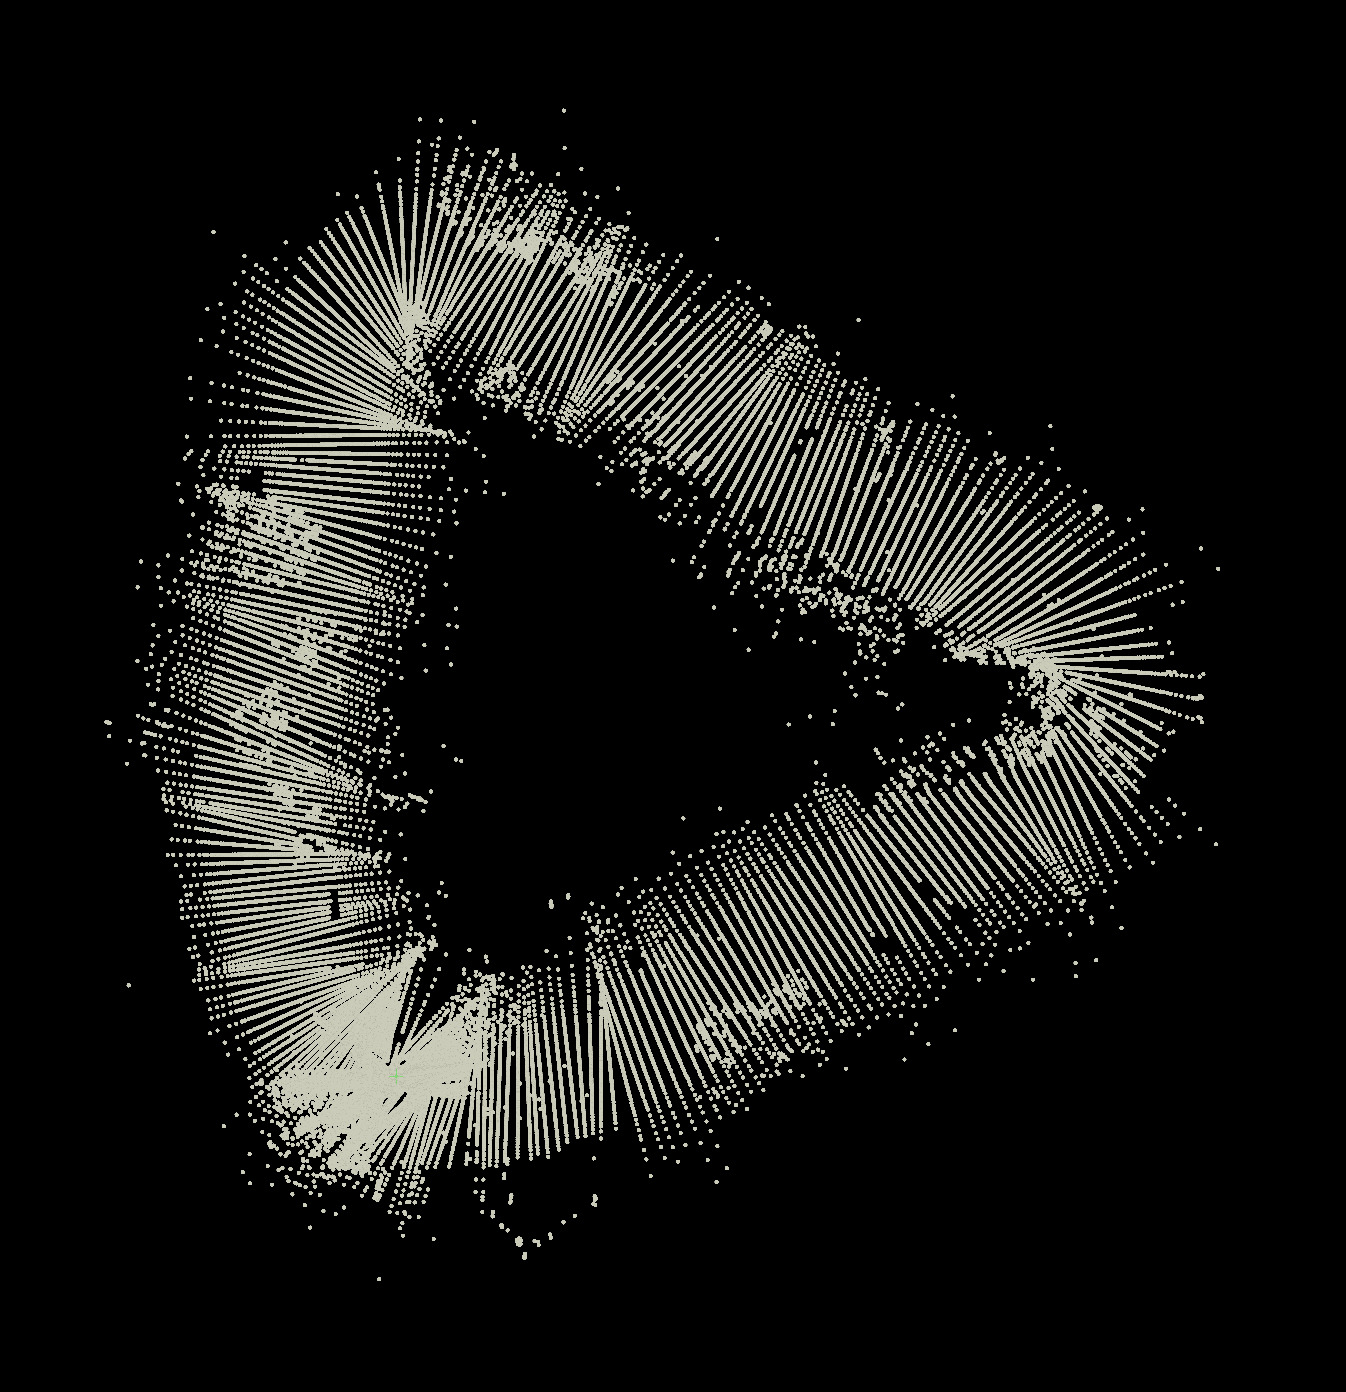
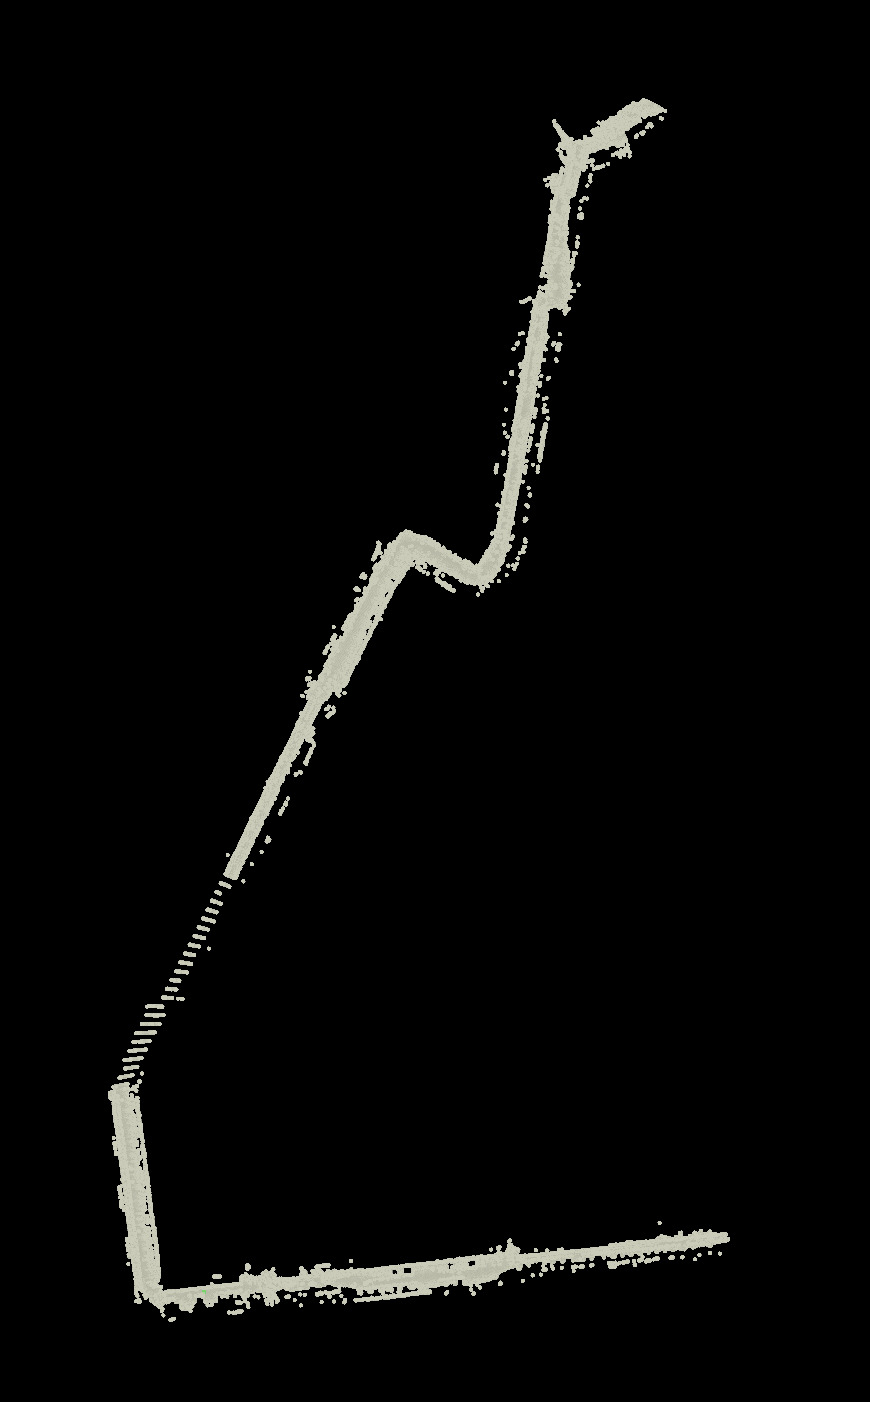
Here’s one of the first scans I did shown from a bird’s eye view:
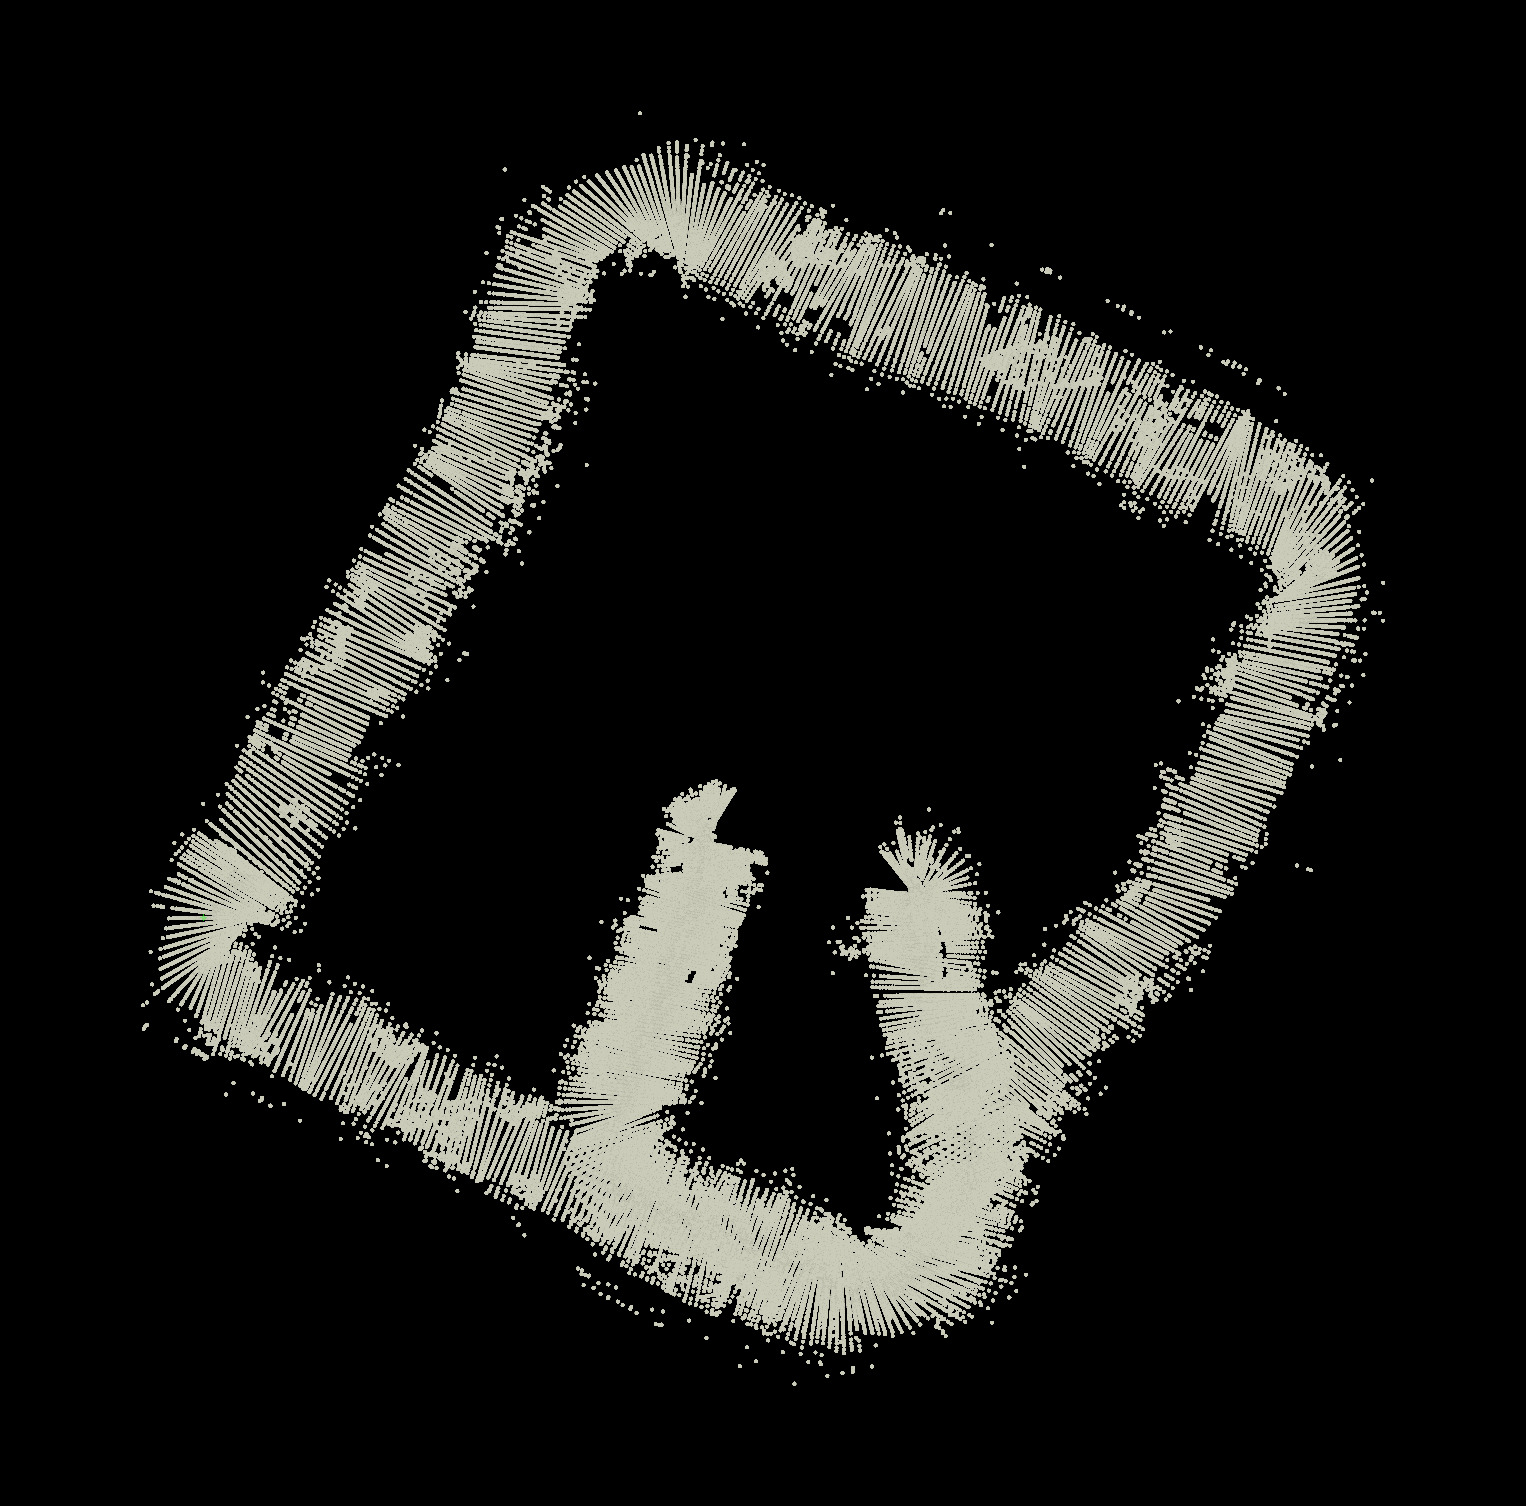
I made a circuit around a rectangular park, starting in one place and stopping in a different place. As far as I could tell by eye everything matched up and there was minimal distortion over the distance. That gave me confidence to try much longer distances.
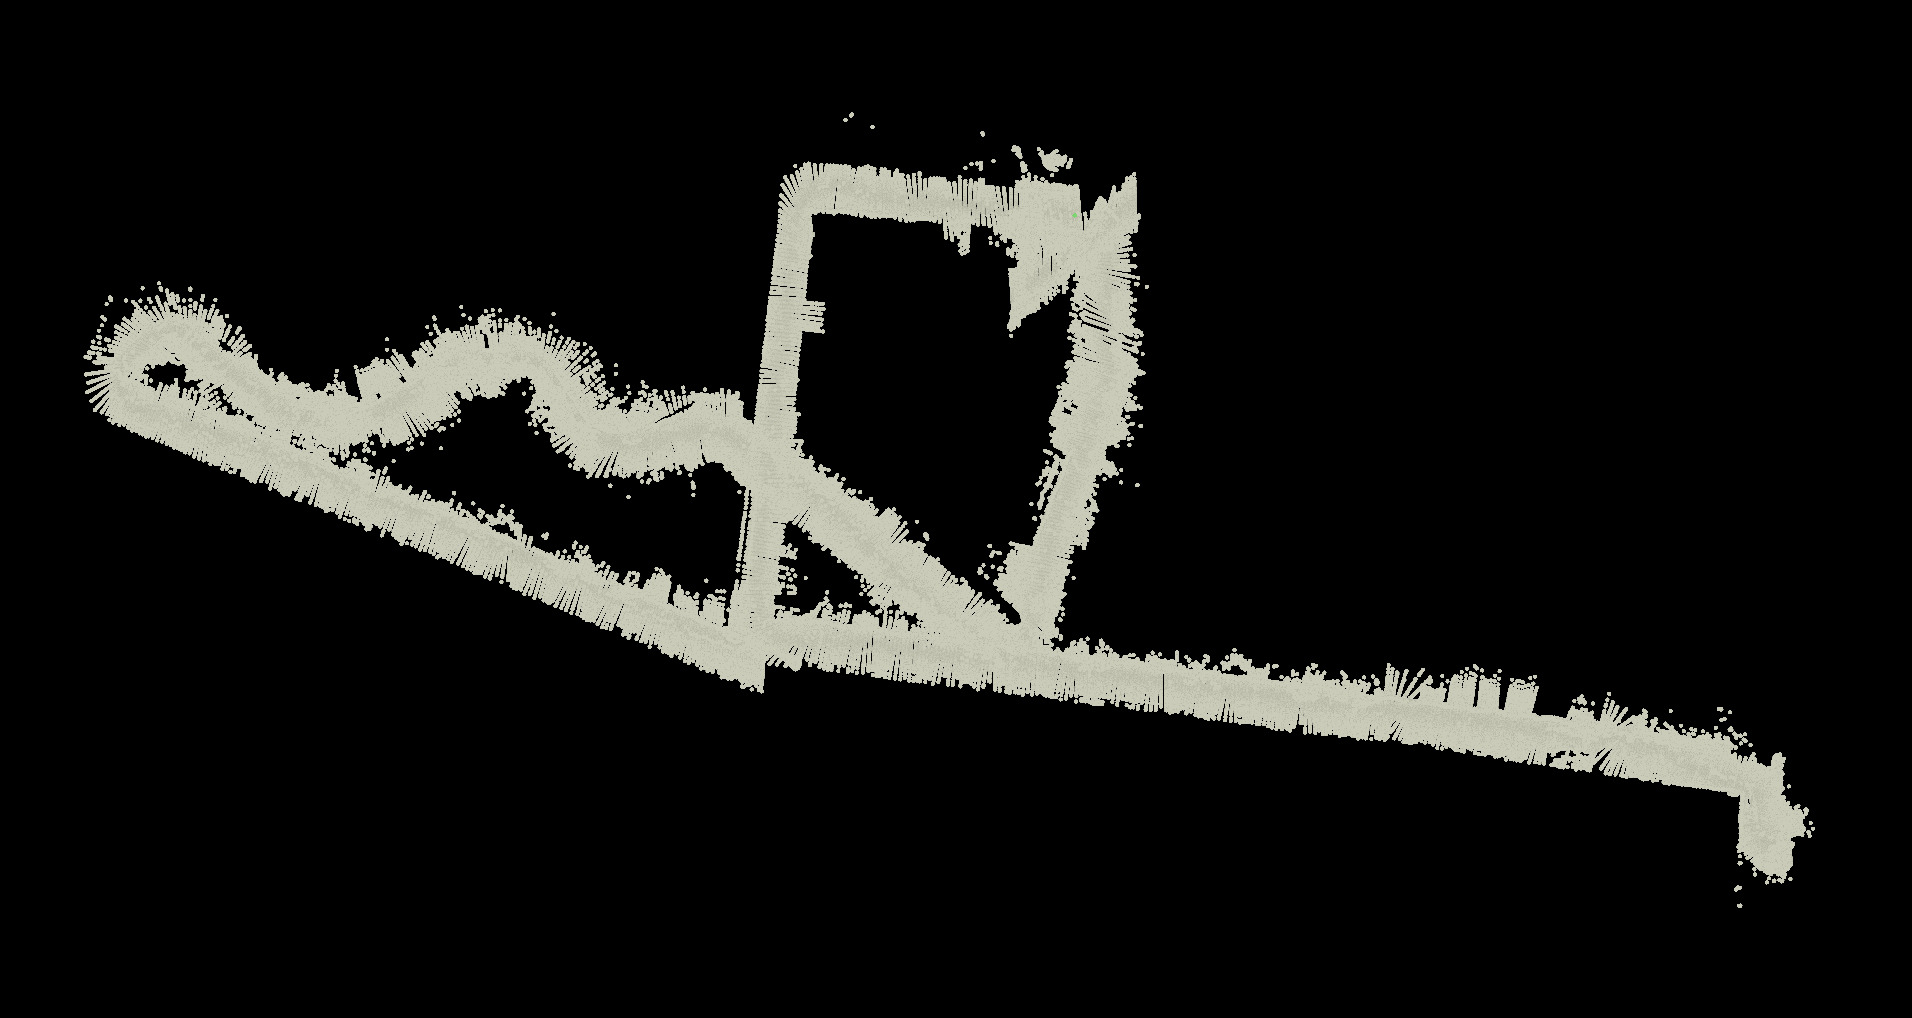
Here you can see a scan overlaid on Google Maps:
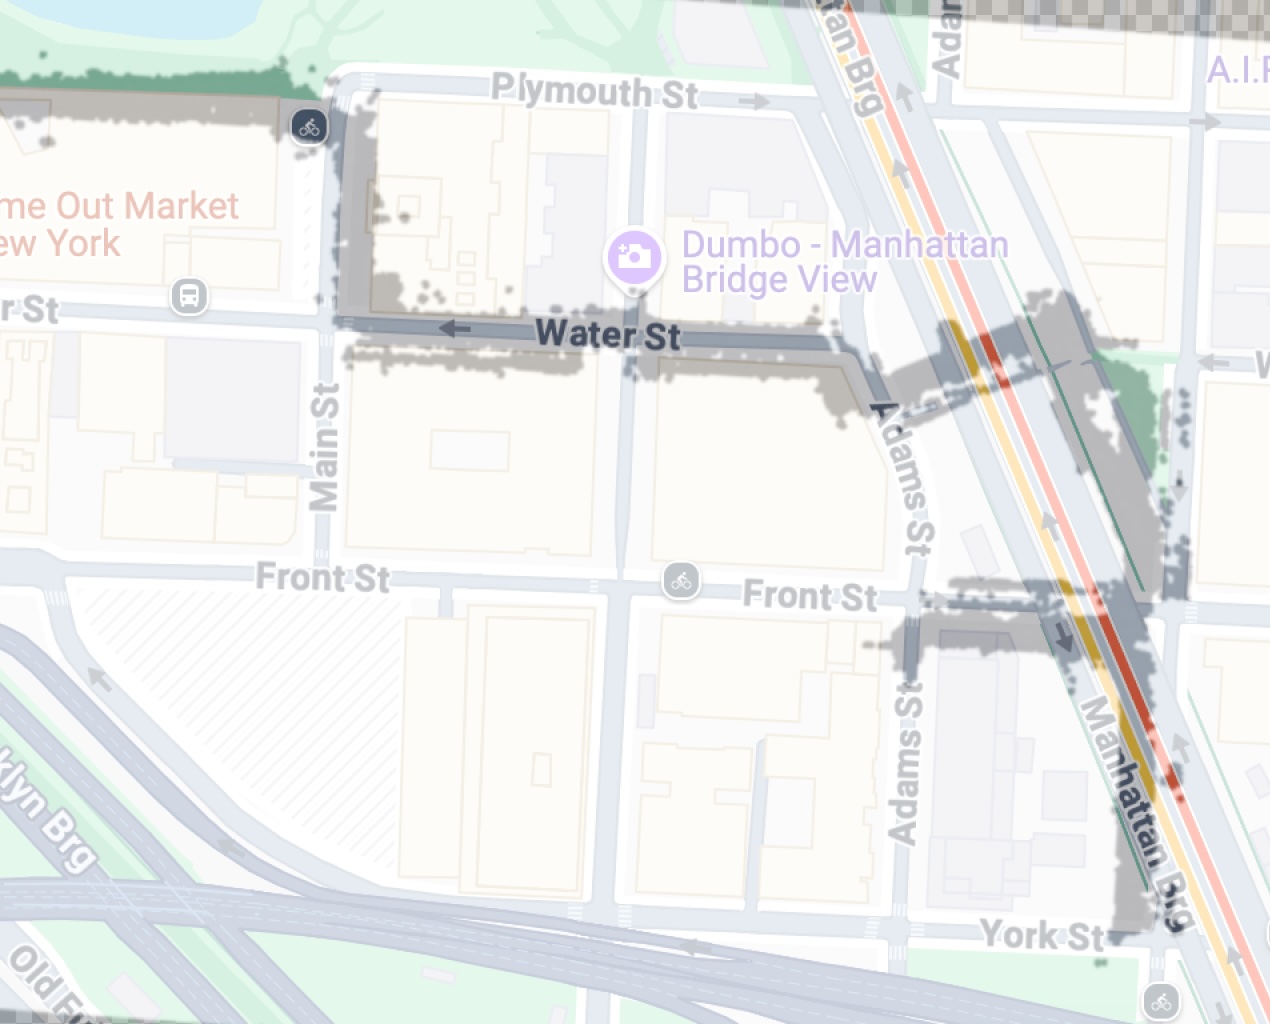
I had started in the lower right under the Manhattan Bridge, meandered down Front St, backtracked and made a circuit around the plaza near the bridge anchorage, went through the anchorage archway, down Water St., and then north on Main St. and west along the water towards the park. Note that all of the scans here are taken late at night well after dark. I think if you’re familiar with the challenges of visual odometry you’ll recognize this consistency over such a distance in low light as extremely impressive. I wish I knew what Google was doing under the hood of ARCore to achieve this.
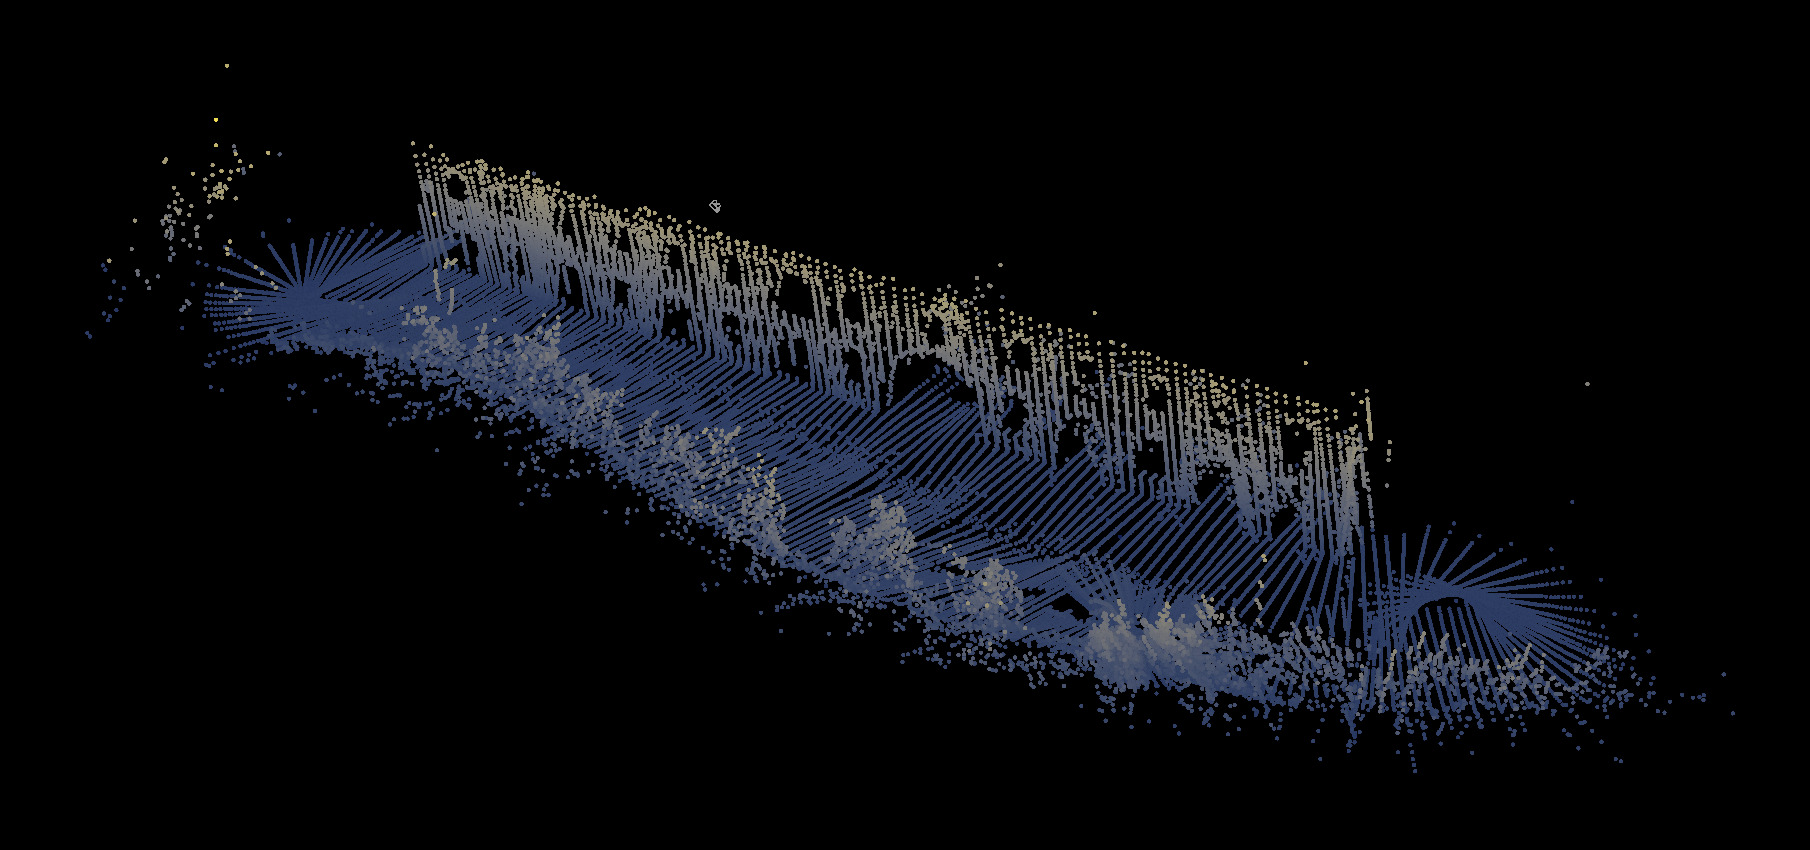
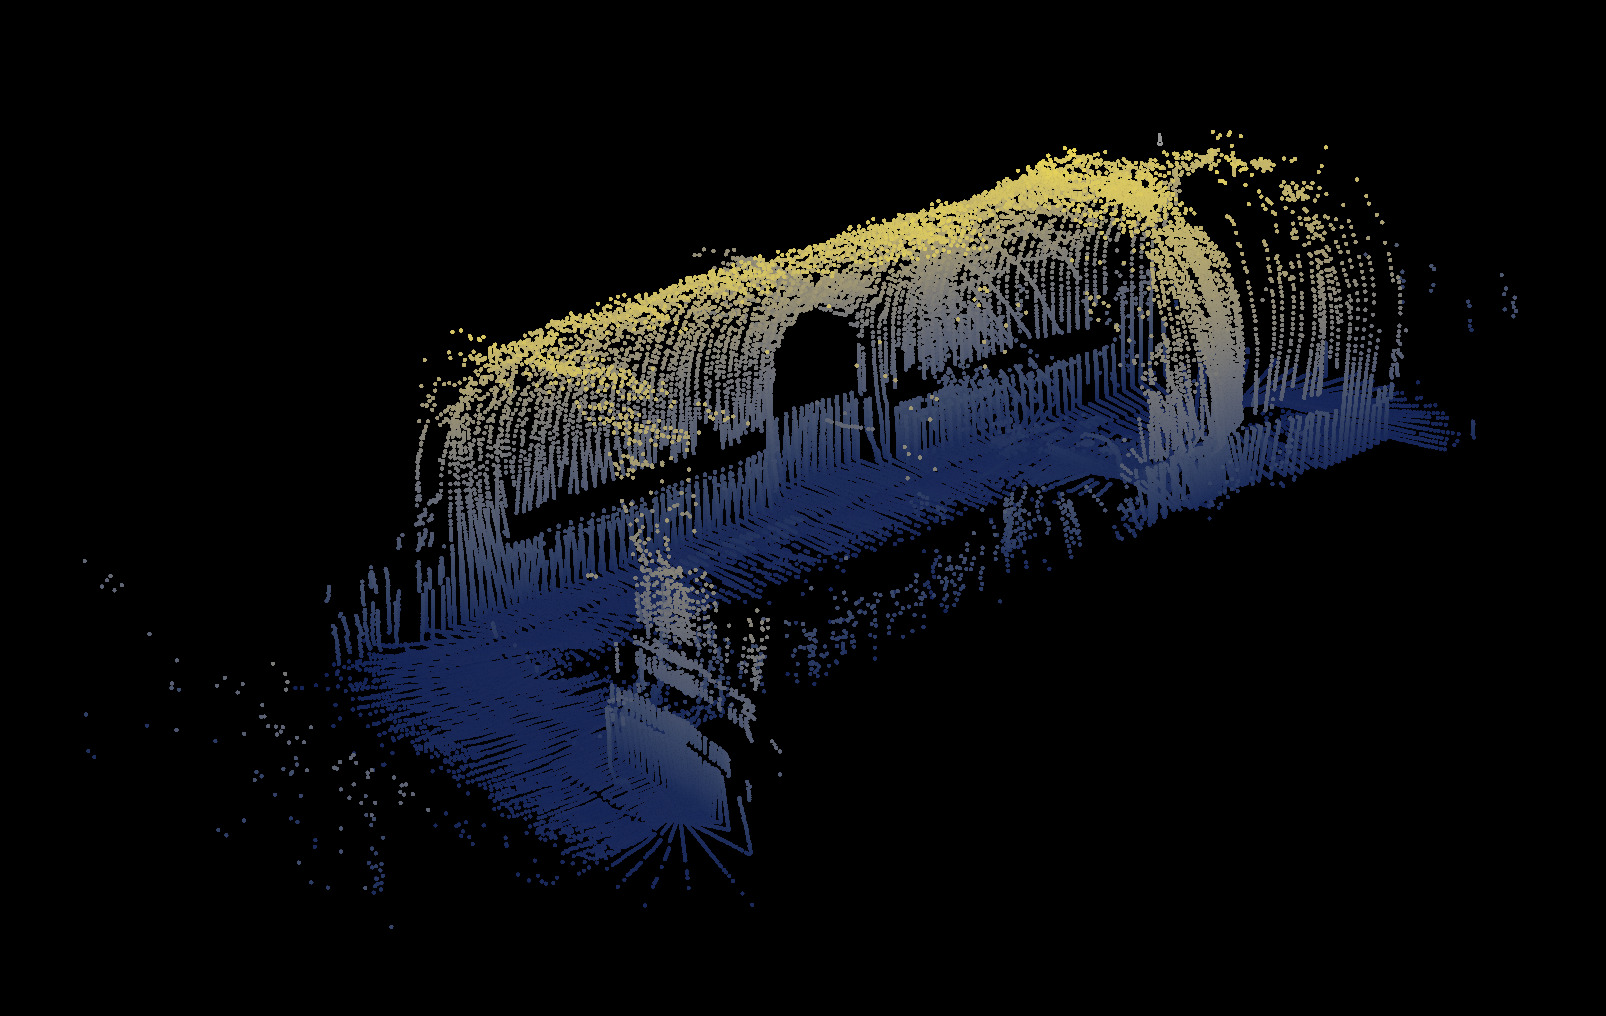
Let’s take a more dynamic and 3D view:
This is me rollerblading through the anchorage from the other direction. It shows the limits of the range of the LiDAR, catching the ceiling of the anchorage archway but not its opposite wall.
Here is a smaller scan from some buildings into a park. You can see points from trees and cars. And how the lines flip around when I turn my head to look for cars while crossing the street:
A quality I like about these scans is that they are not utility maps trying to represent the true structure of the world, like how you’d use Google Maps to get to a destination. These are distorted in a way that shows how I moved through the world. The lines bunch up or spread out as I slow down or speed up. There are wiggles where I turn my head to look for cars and discontinuities when the phone loses track of where it is because I went through someplace dark. There’s texture in the data that comes from me and matches up with my personal lived experience. I had way more fun than I expected when I looked back at the scans and tried to remember where I was exactly at each point. It’s not as obvious as a photo, so I ended up drawing on those other hints to jog my memory.
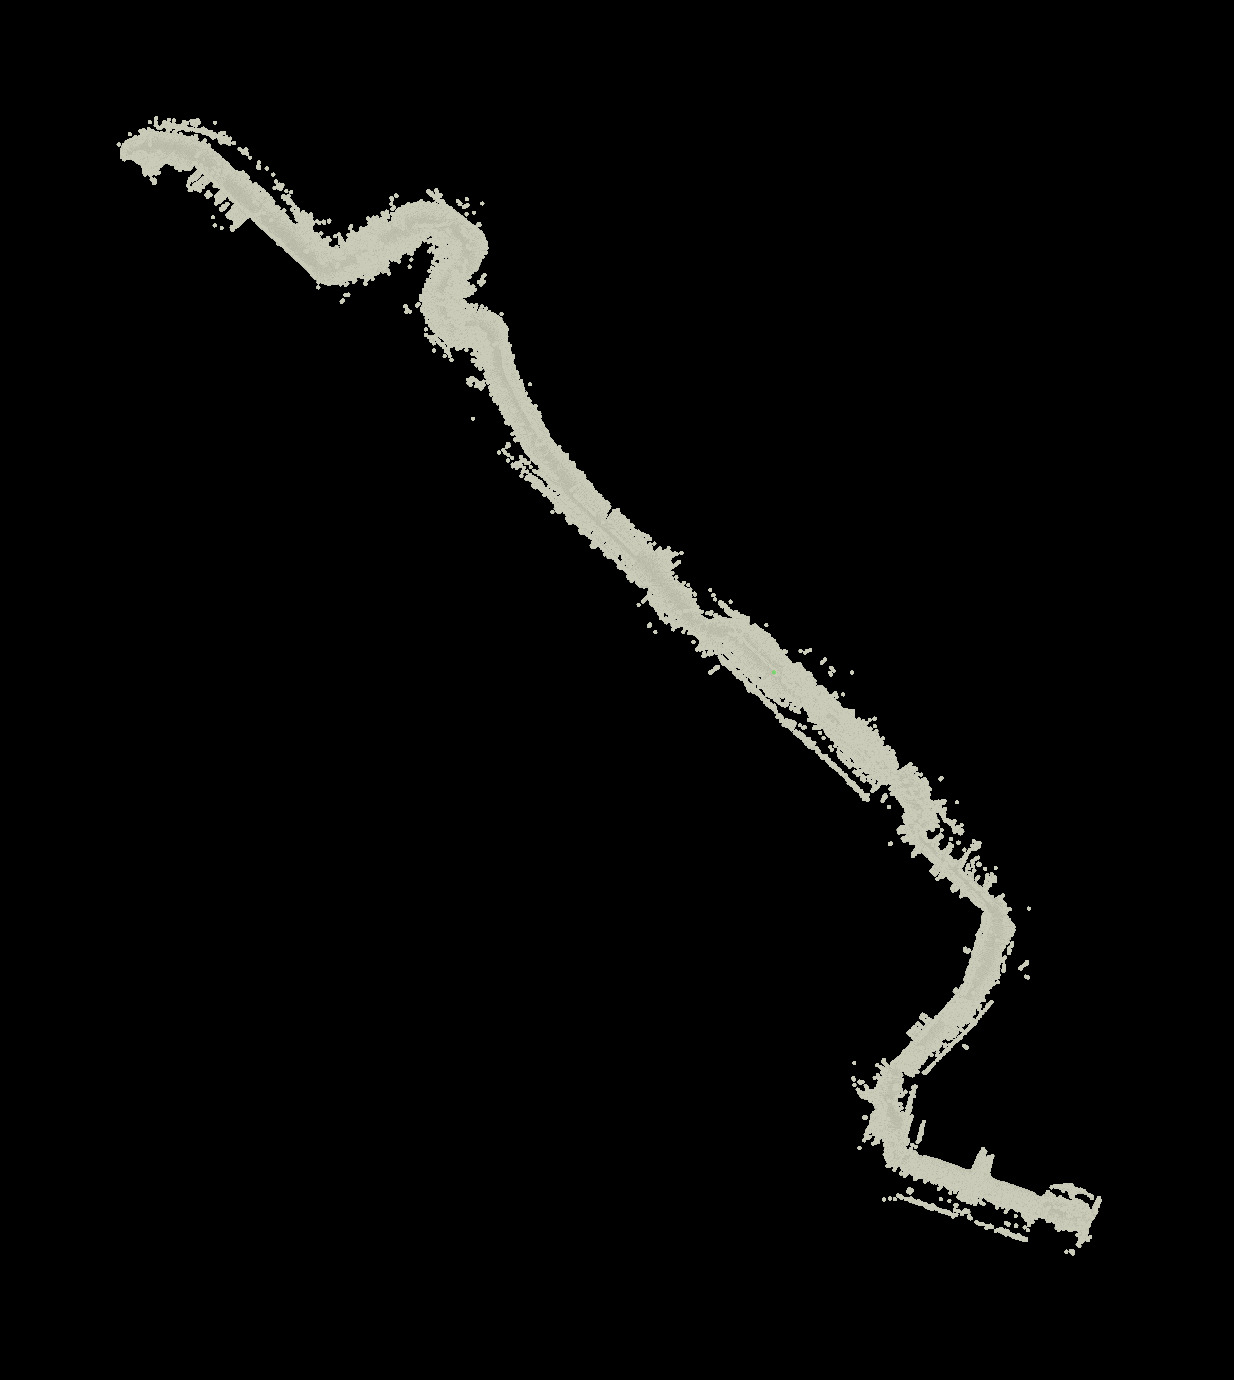
Another quality that I enjoyed from the scans was the abstract shapes they took when viewed from above. These scans vary in size from 10s of meters to maybe kilometers. On some of them you can see major discontinuities from tracking failures.
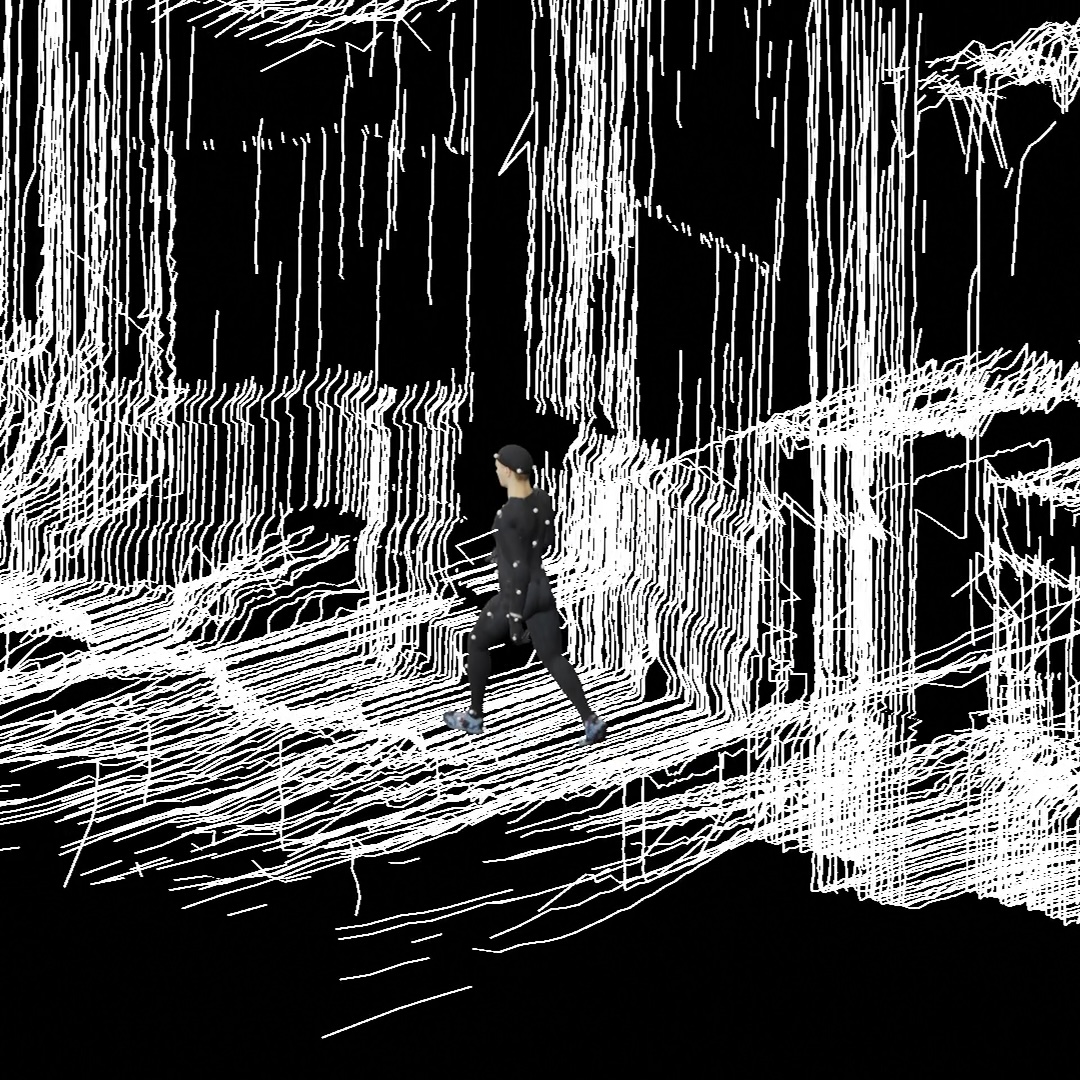
After I realized that the scanner would produce point clouds that were accurate in real world coordinates I wanted to see if I could make a composite render overlaying a 3D render of the scan data on footage of me taking the scan, because I thought that would make it clearer what’s going on. In order to do that I needed to have some means to make a virtual camera match the real world camera exactly. That always involves figuring out two things: 1) the intrinsic parameters of the camera for its lens model (e.g. focal length) and 2) the extrinsic parameters of the camera like where it is in space and how it’s oriented.
That’s why I added the AprilTags on the side of the helmdar, because I thought I might be able to use them to automatically track the 3D position of the helmet in the footage and then align that track with the data from the scan. This ended up being a deep but educational rabbit hole. Just using an AprilTag library out of the box did not work because of poor lighting, low resolution, and motion blur. I tried various means to get around those problems like applying de-blurring to the footage and more robust but slower tag tracking implementations, and maybe I’ll write about those things some other time. But eventually I just wanted to get some visualizations working so I reverted back to semi-automated motion tracking in Blender.
I tracked the corners of the AprilTag in the footage in Blender which produced 4 tracks in the camera pixel space. To get a 3D trajectory from those tracks I needed to solve the Perspective-n-Points problem, which is where you have pairs of points in 3D space and points in a camera’s pixel space and then figure out the position of the camera such that those 3D points would show up at the corresponding locations in the image. This can be done pretty easily with OpenCV, but you need to have the intrinsic parameters of the camera.
There I had a problem because I captured my footage using a GoPro using its wide angle SuperView mode. When I was capturing the footage I liked the wide view and figured I’d be able to work out how to deal with the distortion later. Doing that was harder than I anticipated because it turned out that Superview is a warped view applied in software, so a conventional fish-eye lens model doesn’t apply. What I ended up doing was unwarping the footage using some cool open source software called Gyroflow which includes ST maps for many types of lenses, including the soft-warped GoPro Superview “lens”. After that I was able to take footage I shot containing a chessboard calibration pattern with opencv_interactive-calibration to determine the intrinsics I needed. Then I could do any VFX I wanted, render out, and then reapply the warp at the end if I so desired (in the end I didn’t bother adding it back). I was interested in trying something like this because I heard it’s what was done for the VFX in the movie Hardcore Henry.
So with the Blender tag tracks from the unwarped footage and camera intrinsics in hand I applied the OpenCV perspective- n-points solvers to get the tag track in 3D. Then I brought that back into Blender and manually lined it up with the scan poses reported by the helmdar rig. Finally, I used geometry nodes to animate the scan data filling in.
I made a quick-and-dirty point cloud viewer so you can interactively view some of the scans. Tech note: All of the point cloud visualizations were made in SideFX Houdini and I set up a little pipeline from there to this viewer so I can keep the same camera and colors.
Here’s a scan I made while talking about the project at Side Project Saturday:
Comments
To leave a comment, you need an Are.na account. Comment on this post’s Are.na block and it will appear here.