I recently showed some artwork related to my rollerblade street scans in an NYC Lower East Side gallery. Those were made with lidar so I thought it would be fitting to use laser beams to make cyanotype images based on the data. Below I’ll take you through what I learned while hacking together the process and how I put together the final laser plots.
Many years ago I built a rudimentary laser projector from an XY galvo kit off of Amazon and a BeagleBone driving 12 bit MCP4725 DACs through some op amps. The DACs were what I had laying around but were very slow so I couldn’t accomplish persistence-of-vision for any interesting graphics. I made some long exposure photographs and then put it in a box. But for this project I had the perfect excuse to dig those parts back out, because I would be moving the laser very slowly anyway to get sufficient exposure time for the cyanotypes.
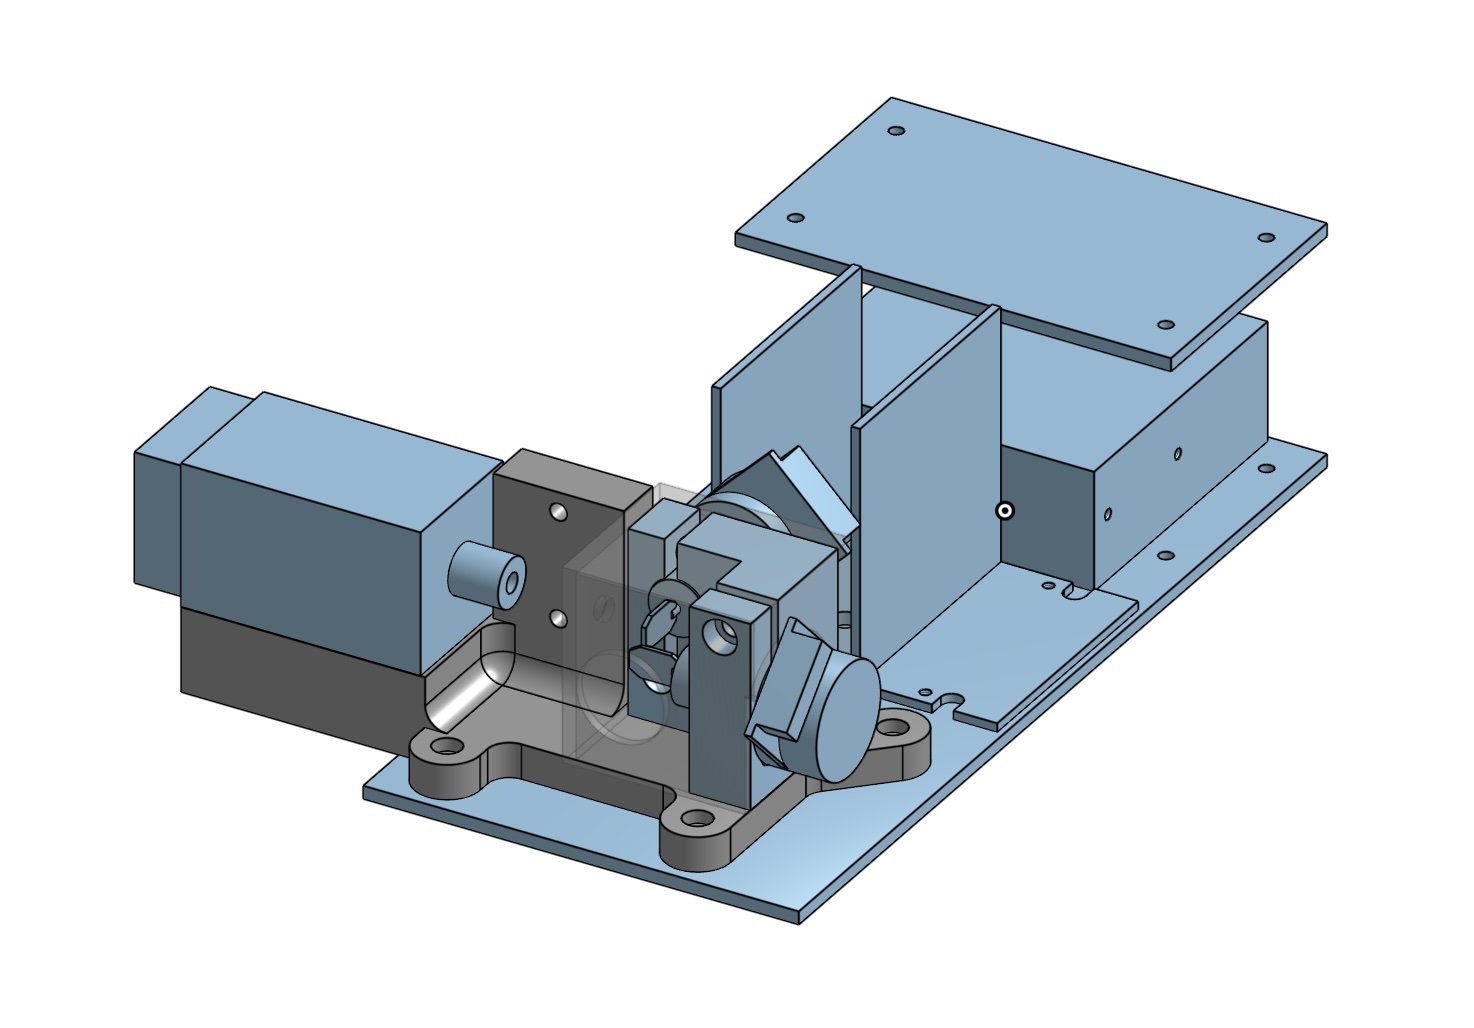
I quickly but roughly blocked out the parts in CAD and got a basic layout together. Then I laser-cut the bottom plate and 3D-printed the laser galvo assembly. The image above shows the last version but initially I had the mount set up for a much smaller laser. The laser shines in through a hole in a shroud (made transparent in the render) onto the first galvo mirror and then bounces off that and the second mirror out the larger hole on the front.
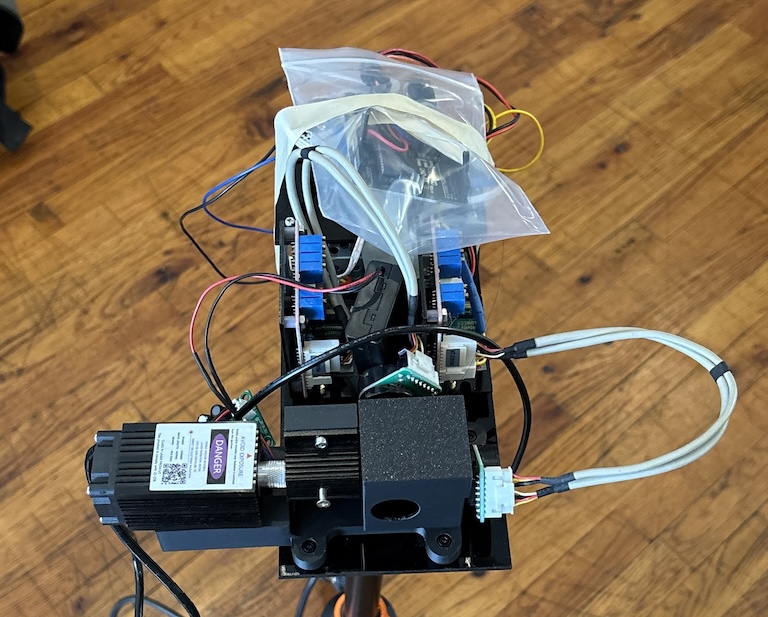
Not very pretty but functional enough- I was trying to be as functionally lazy as I could to save time. The Arduino is in a plastic bag to prevent it shorting out against the board holding the DACs and amps and the galvo power supply. There’s a AA battery pack tucked in for a 5mW red laser that I used while testing the software.
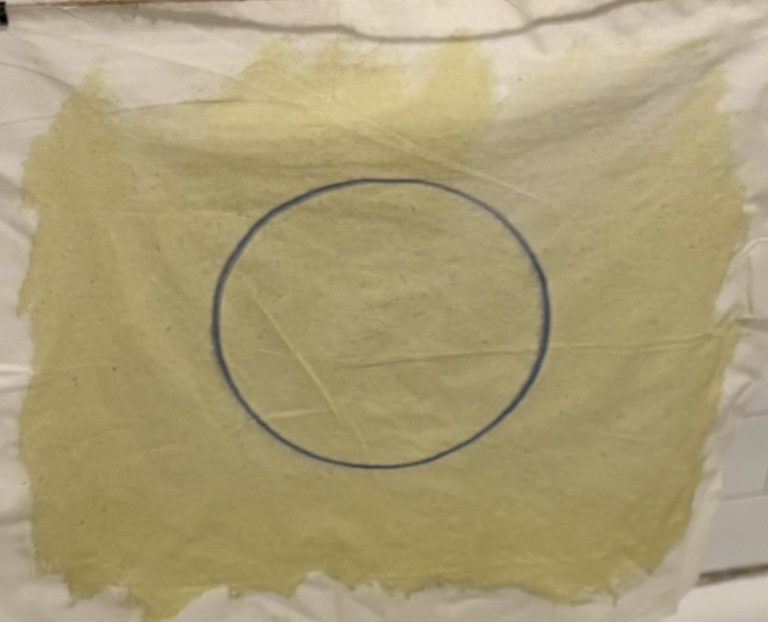
40 minute circle exposed with 5mW UV laser.
Initially I tried a 5mW(?) UV laser of unknown provenance that I had in one of my junk bins. This did work but only barely. It took 40 minutes to expose a small circle. I was going to need to go much faster to have any chance of getting the final work before the show, let alone the many tests I knew I was going to need to do to get something I was happy with. So I went on Amazon and bought a 250mW 405nm laser intended for laser engraving.
Every human who values their eyesight should fear lasers. They are very effective at damaging eyes even at low power. With very low power visible light lasers you might be protected by your blink reflex before serious damage occurs. But at powers >1mW or with lasers outside the visible range exposure can mean essentially instant blindness. Even if you get lucky there can be other kinds of deleterious effects. Damage from UV light exposure accumulates over your lifetime and can lead to cataracts later on.
The laser came with cheap plastic safety glasses but I wouldn’t trust those. Initially I ran tests by putting everything in my apartment’s windowless bathroom and only powering it on with the door closed and me in another room. I used webcams to watch what was happening remotely. But when I went to make larger scale plots I was struggling because the laser dot wasn’t in focus. I didn’t see a quick way to set it up to adjust the focus remotely so I needed some way to protect my eyes while I did the focusing by hand.
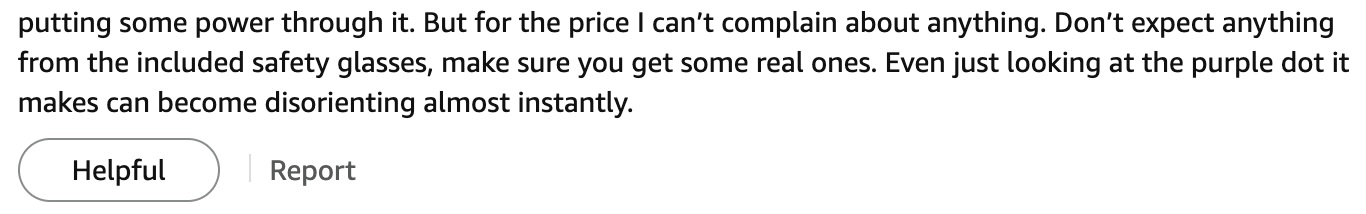
Please don’t ever do this just because it worked for me. I sealed the light leaks in my Quest 2 with foam and taped it all over with aluminum duct tape to avoid any chance of light unexpectedly leaking through plastics or cracks (image above shows it partway through the process). Then I used passthrough to see what I was doing via the cameras on the headset.
This ended up being more useful than I expected when used in combination with a bit of software I wrote to pipe video from webcams into the Quest’s browser. It let me set up a camera with a tiny aperture that was zoomed in at a tiny spot on the work and watch the live feed in augmented reality while focusing the laser dot. And then I could switch over to a webcam with a wider shot to line up the work area before starting a plot.
Cyanotypes are made using chemicals that turn into Prussian blue pigment when exposed to enough UV light. If you have seen old-style blueprints then you know the color. Usually the way they work is that you mix your cyanotype formulation and then apply it to paper or cloth, let it dry, and then expose it behind a mask under the sun. The mask can be anything you want- household objects, plants, or transparencies that have had an image printed on them. After exposing for up to 20 minutes (depending on the strength of the sunlight) you wash your print and let it dry.
The process has a lot going for it:
An Arduino Uno received commands over USB serial for controlling the laser projector. For running the full plots a Python script on my laptop read a giant JSON file containing the paths that needed to be plotted and at what speed and kept the Arduino’s command buffer full.
It was important to carefully control the speed of the beam because that directly affected the final look of the exposed line in the cyanotype. At one point I had a bug where the beam would stall while on if the command buffer was empty which resulted in a plot taking 8.5 hours instead of 2 and being completely covered with dots.
For set-up I also had a Processing sketch that provided a simple GUI to let me drag the beam around with the mouse and send it in a few patterns, like a rectangle at the extreme projection bounds so I could line up the work area with the material.
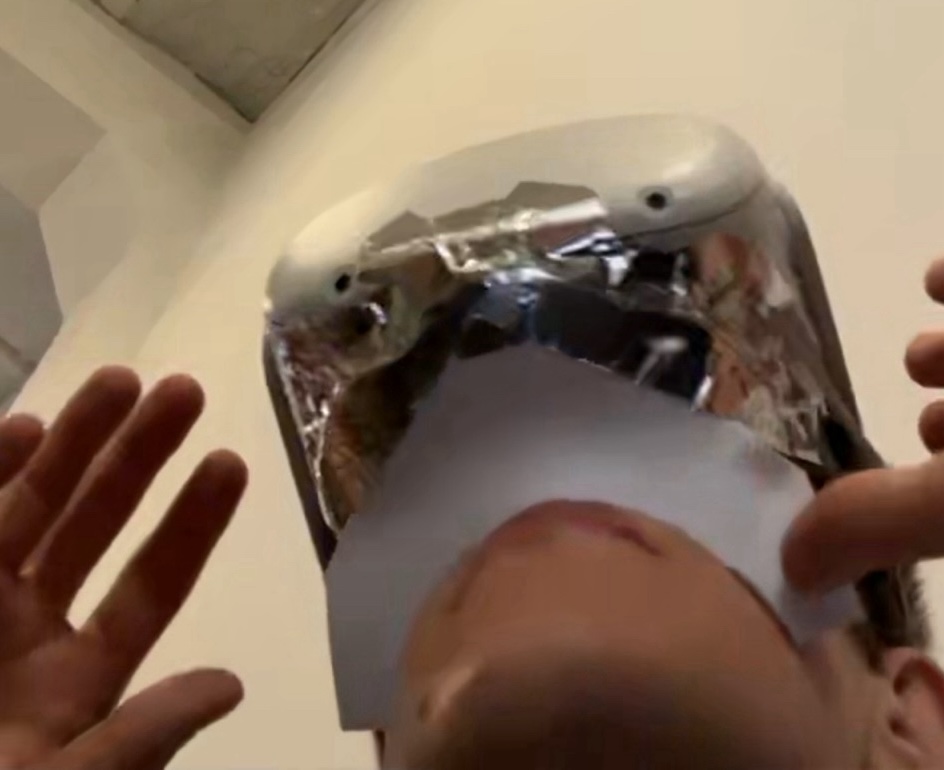
Even though the cyanotype process is easy in principle it still took some experimentation to get a reasonable result, and there’s still a lot of room to improve.
In the image above you can see examples of most of the issues I encountered:
The fixes were simple:
One persistent problem that I was unable to fix was with the line pattern. No matter how carefully I focused the laser dot I would get a horizontally doubled line. My first thought was that maybe I didn’t have first surface mirrors on the galvos but I took a look and confirmed that I did. While playing with the focus I saw the dot shape morph quite a lot. I didn’t have time to investigate more but I’m guessing it could be due to issues with lens alignment or shape, and the shape of the laser diode. I would need to fix this if I wanted to get clean images with thinner lines at a larger scale.
A note about laser exposure- when I was looking for what laser to buy I came across this paper called, “From Ultraviolet to Prussian blue: A spectral response for the cyanotype process and a safe educational activity to explain UV exposure for all ages” where the authors used a xenon arc lamp and a monochromator to expose cyanotypes with a fixed amount of energy. They showed that wavelengths between roughly 300 nm and 350 nm work best. At 405 nm the effectiveness has already dropped to 50%, and beyond about 420 nm there’s essentiallly no response. Unfortunately this lines up poorly with the cost distribution of UV lasers.
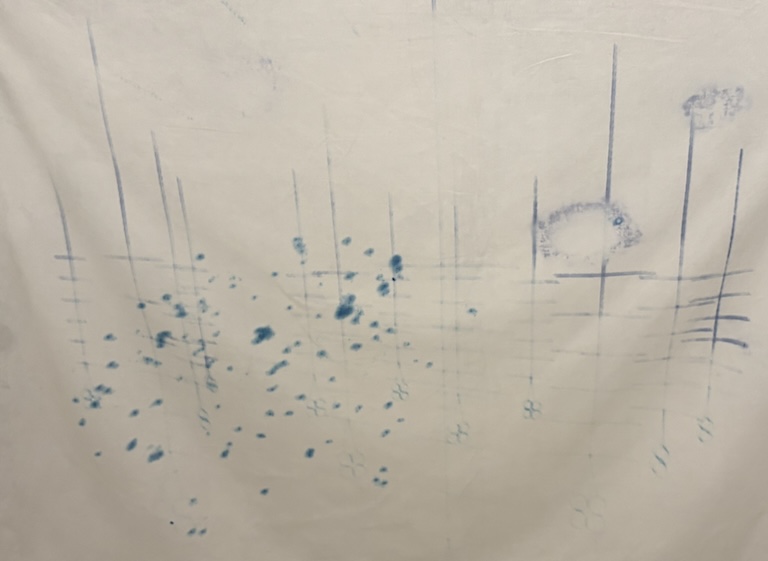
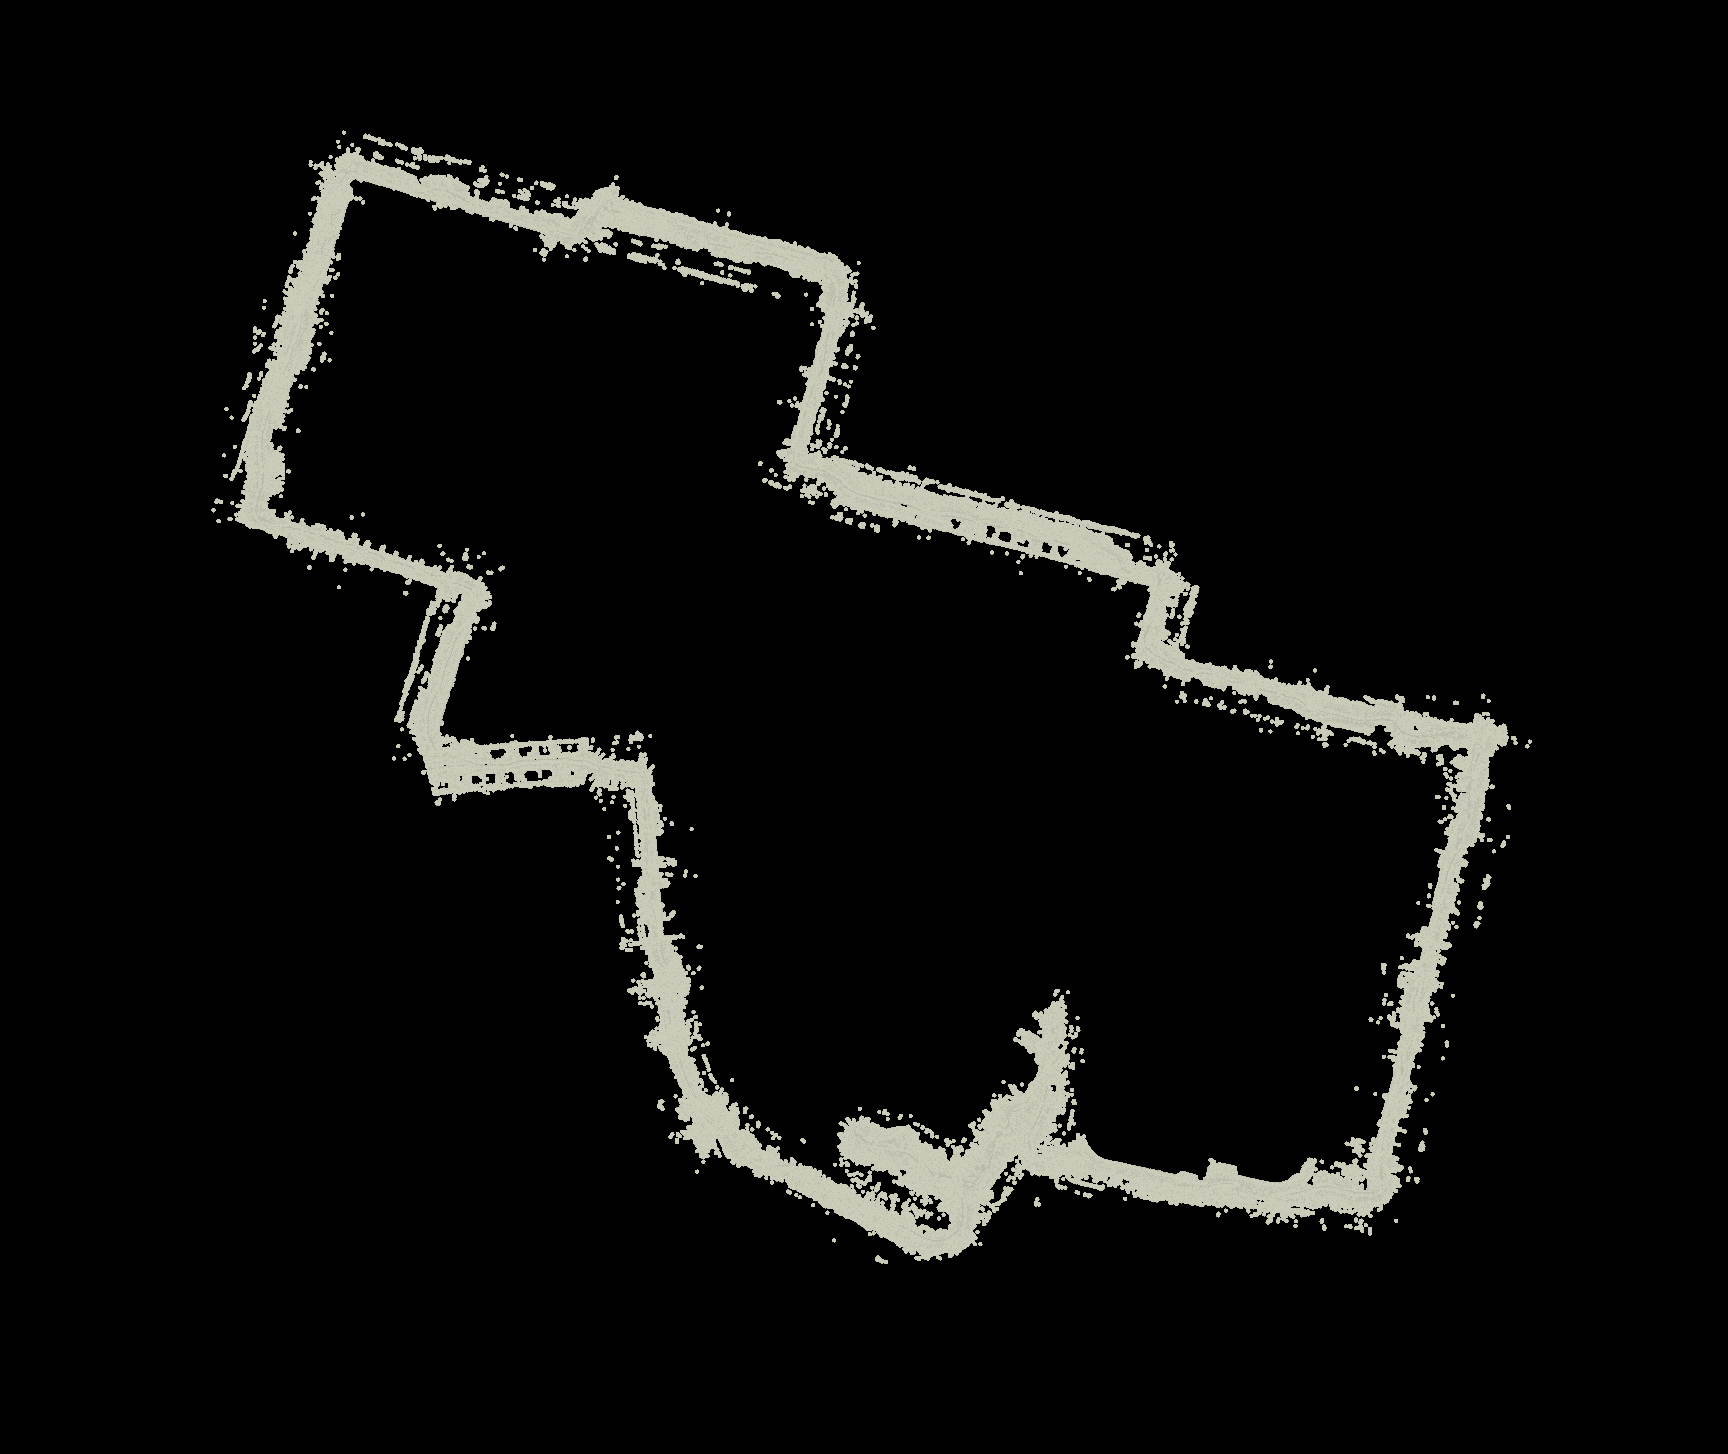
Here are the two final plots:
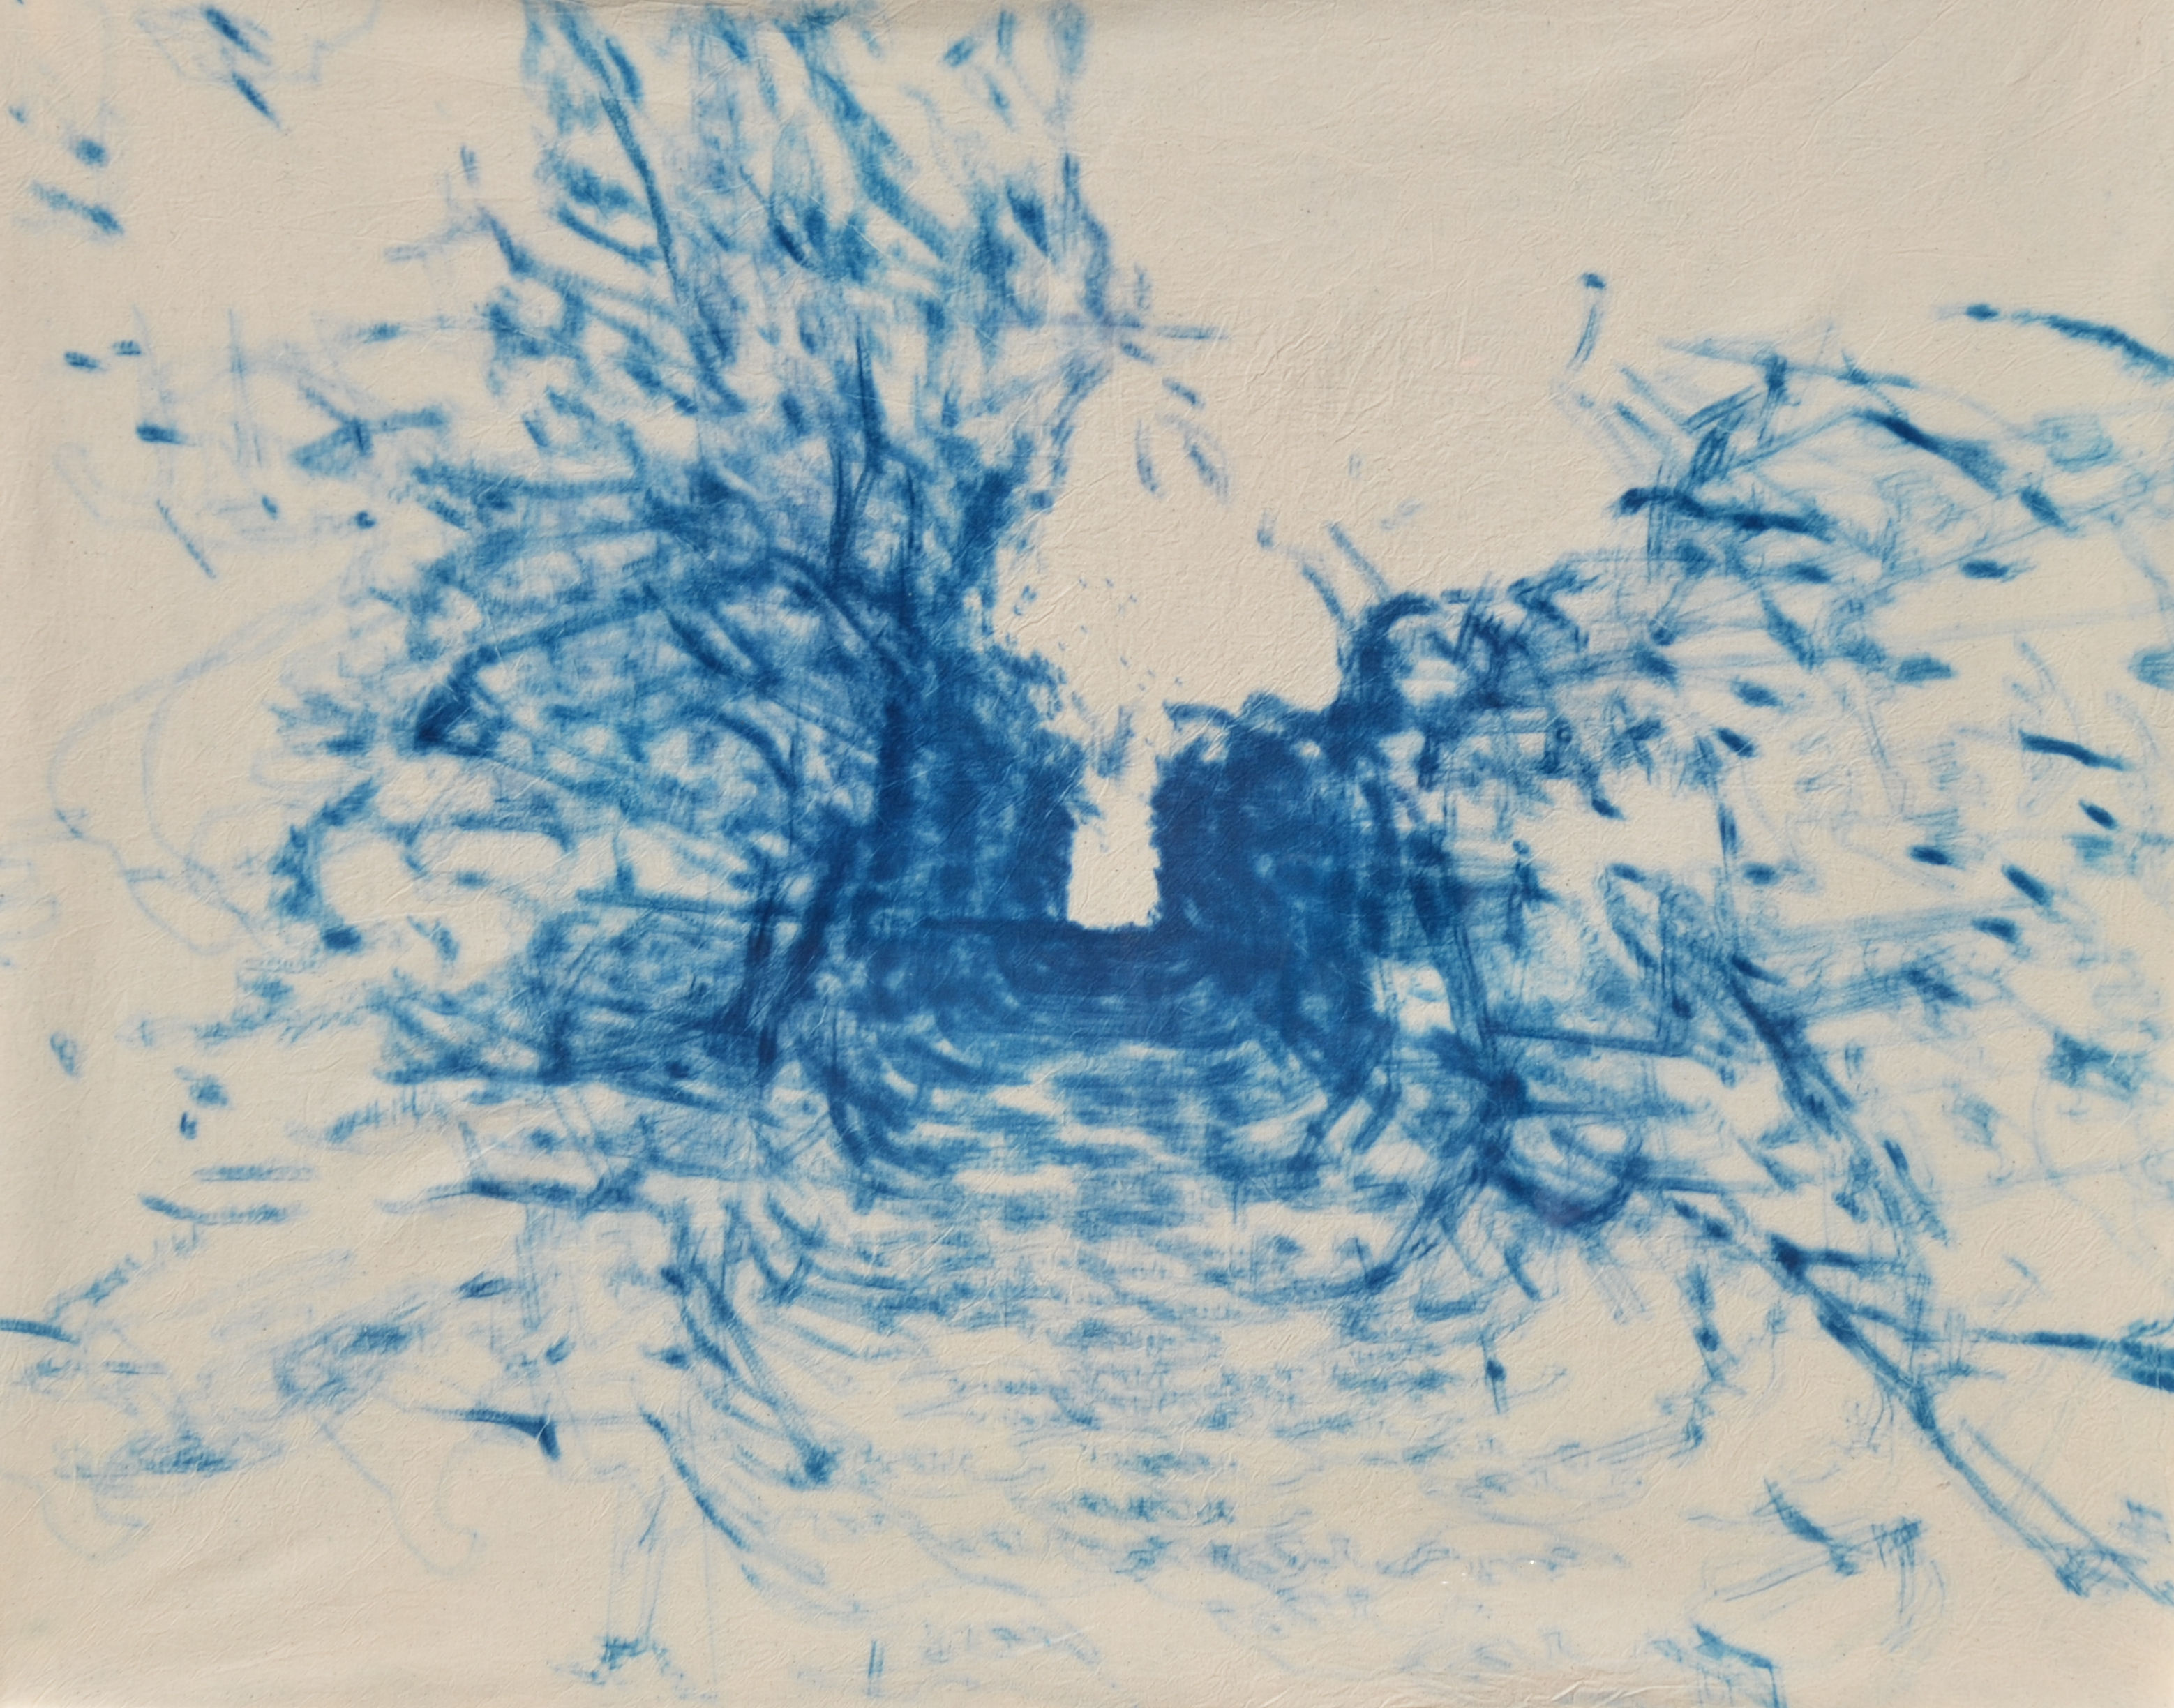
The first is a birds-eye view of a scan I took starting in a park near my apartment. I rollerbladed along a path, crossed a street (you can see where I turn my head to check for cars on the lower right), and then went alongside my apartment building to the door, walked up the stairs, went down the hall, and entered my apartment (the lines spreading out on the upper right).
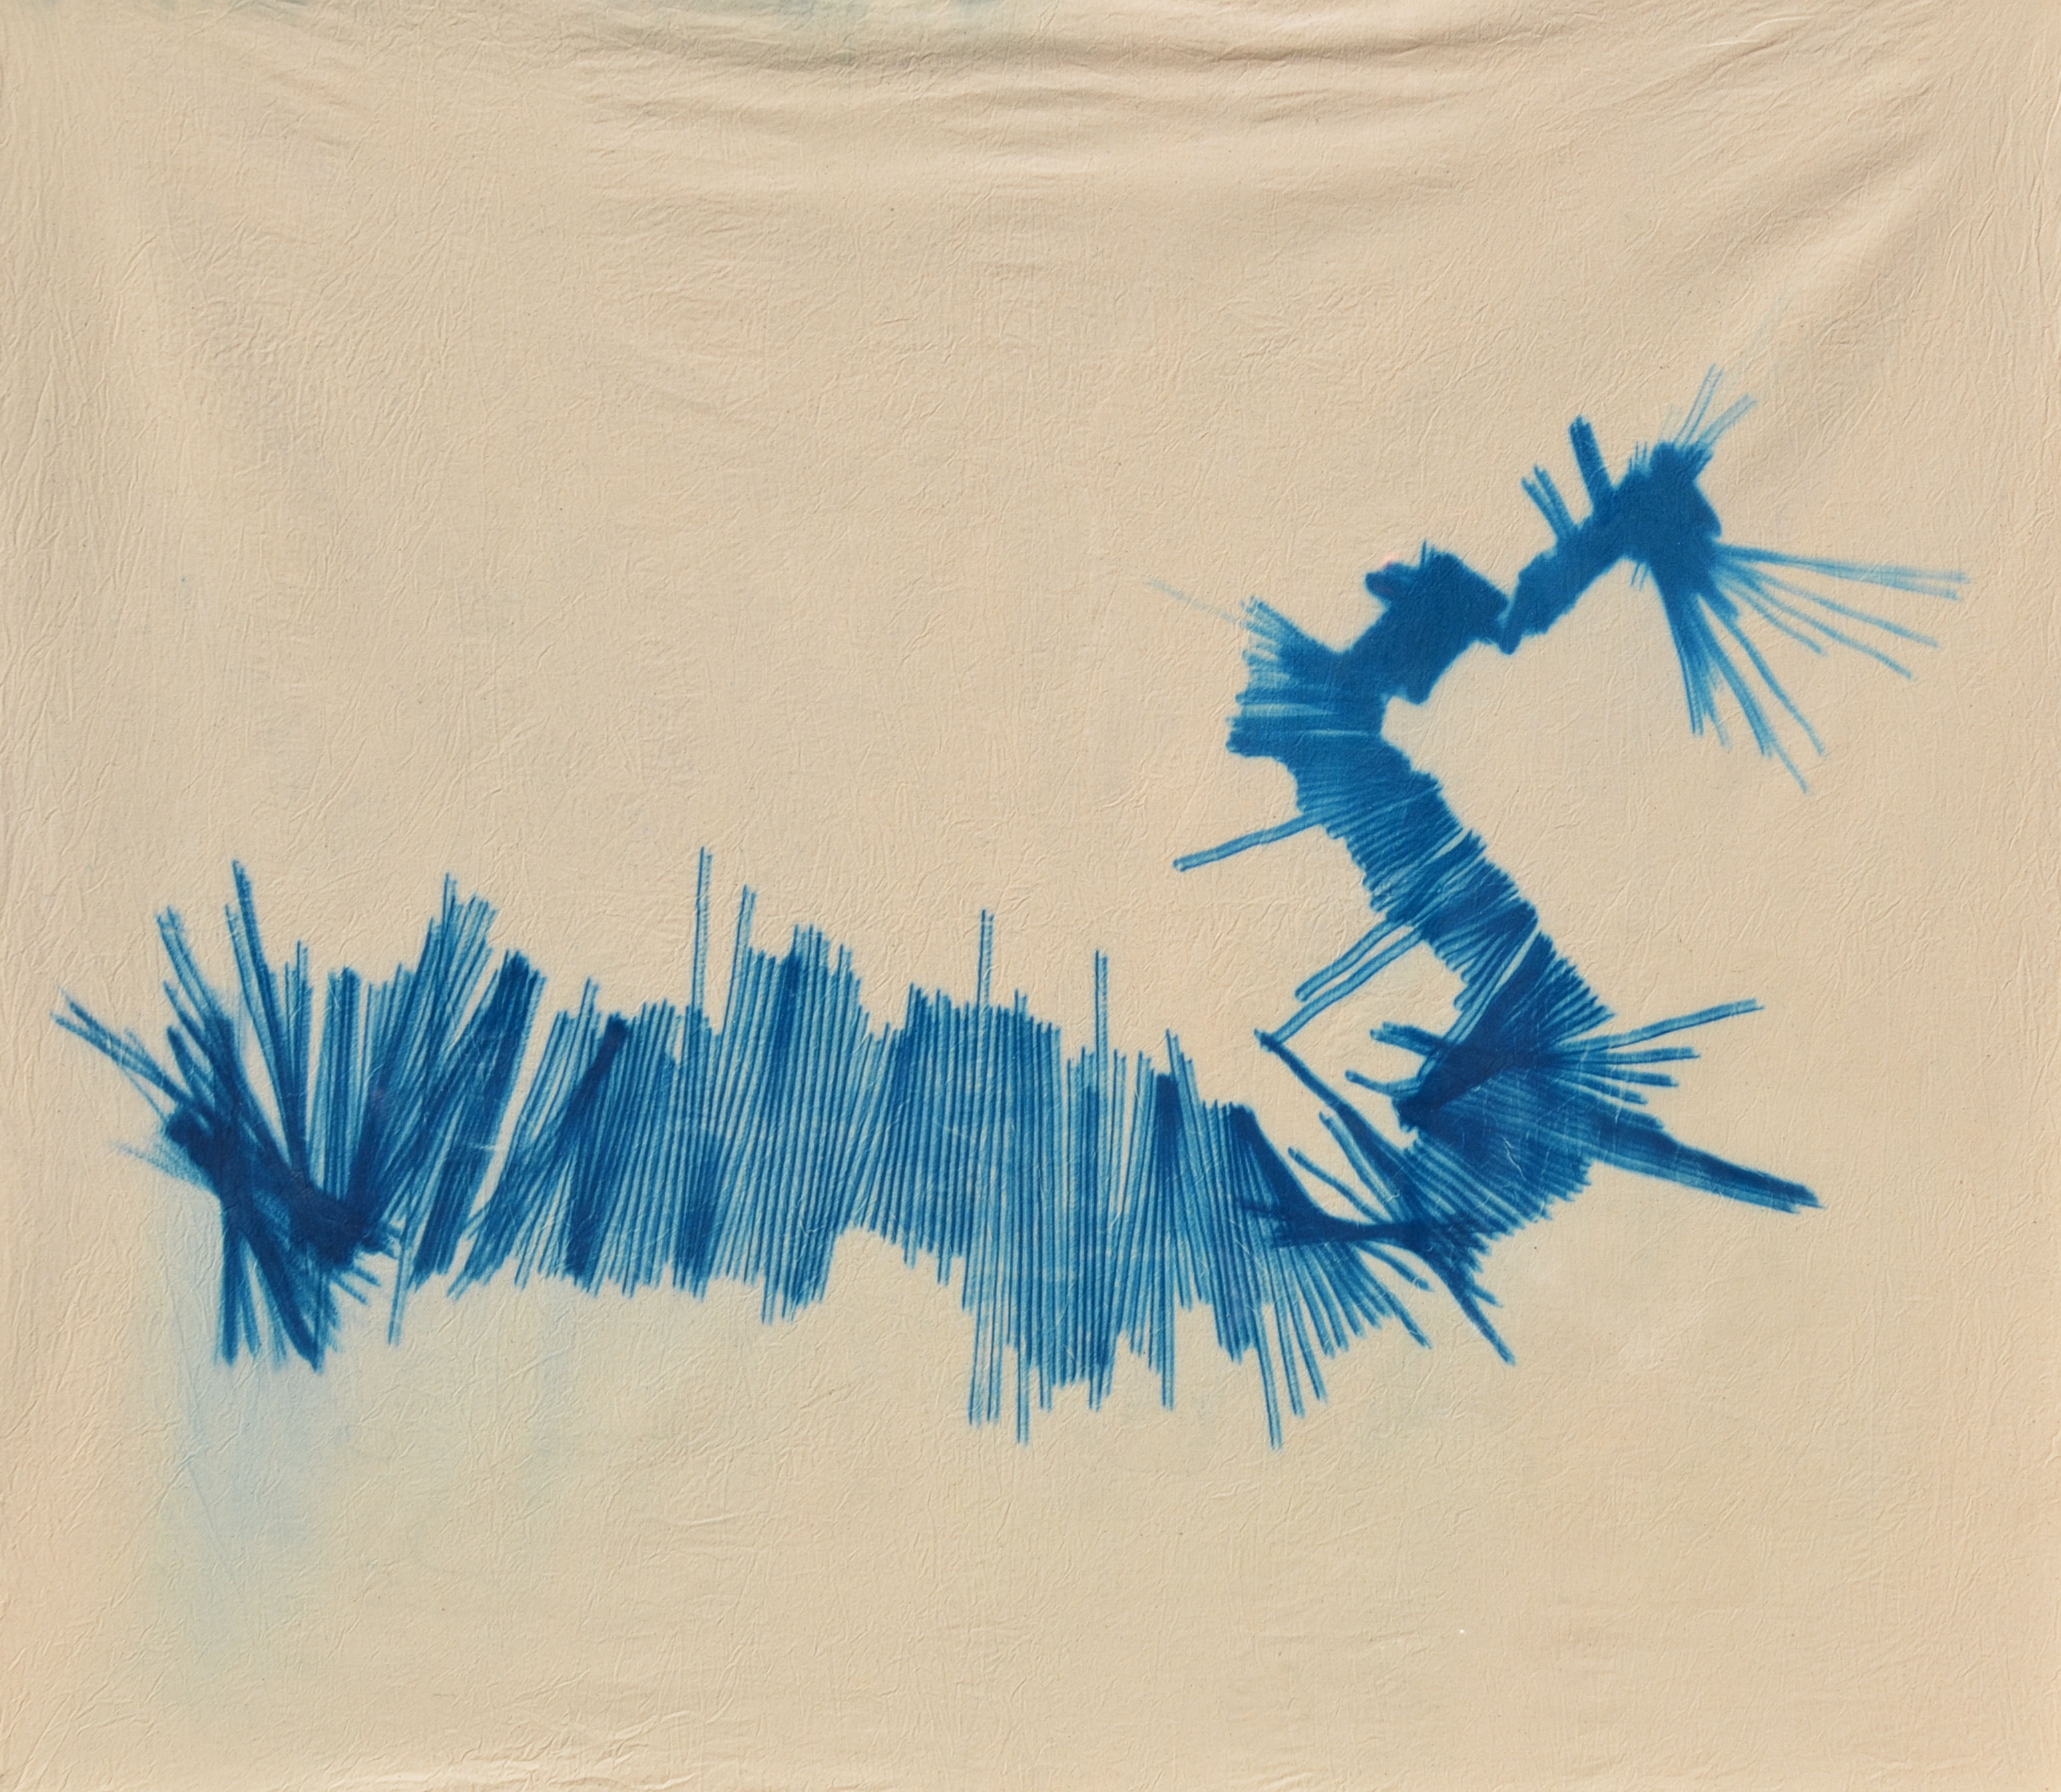
The second is a perspective view of a scan down a path entering the Brooklyn Bridge Park Greenway lined with bushes on both sides.
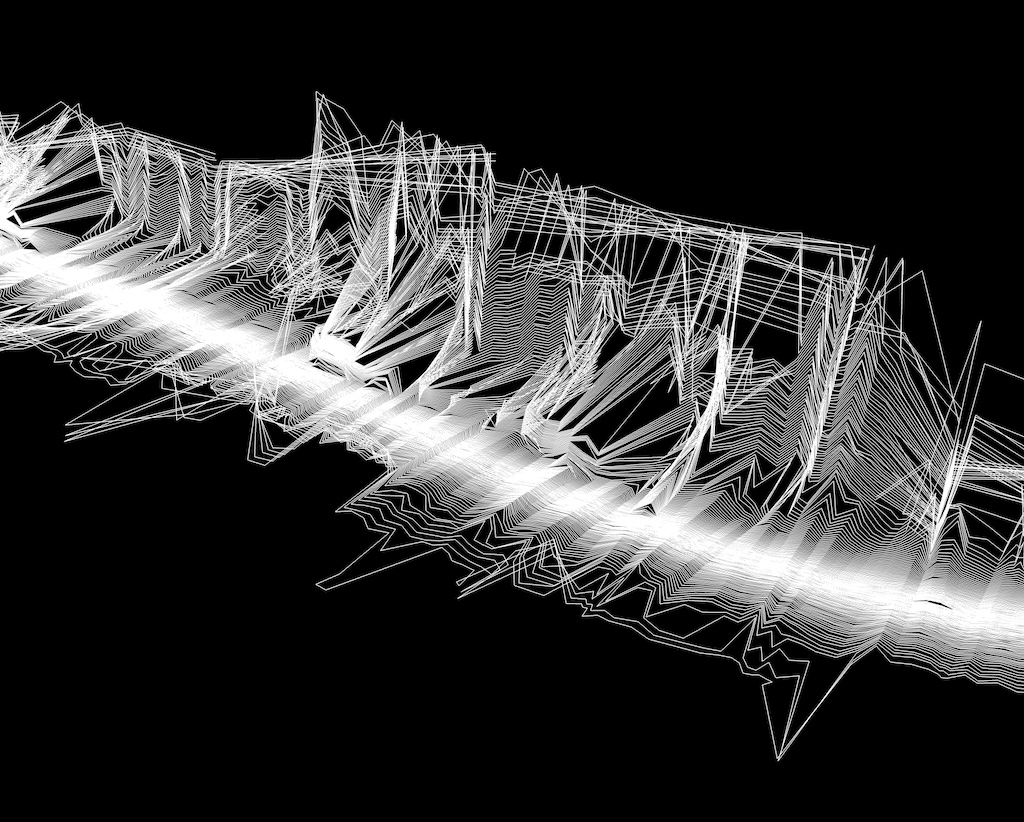
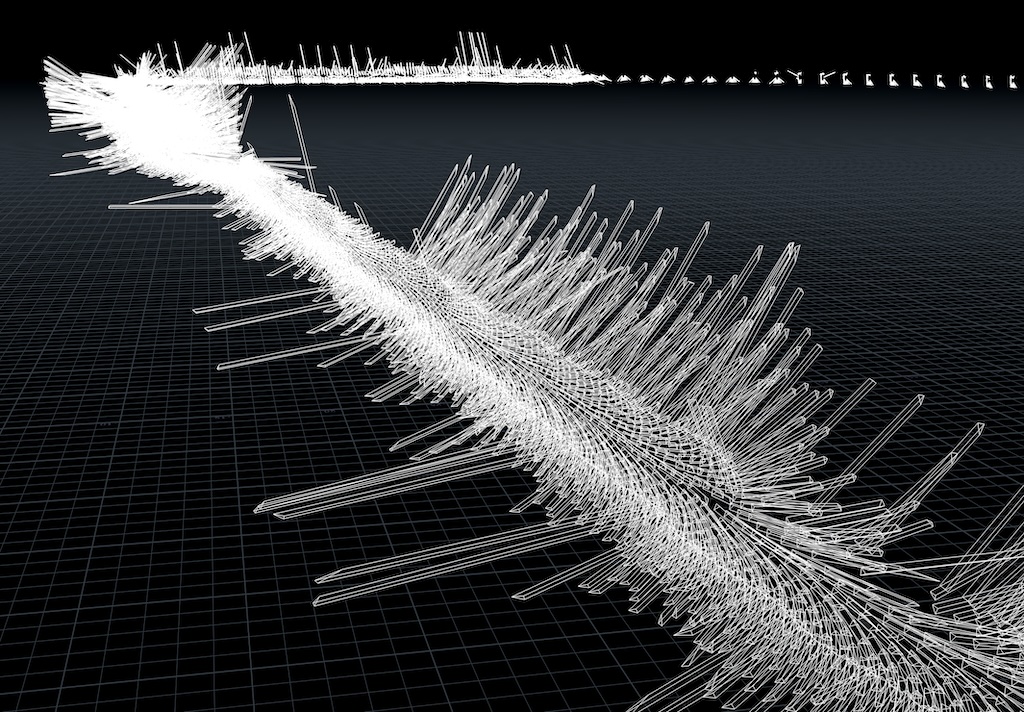
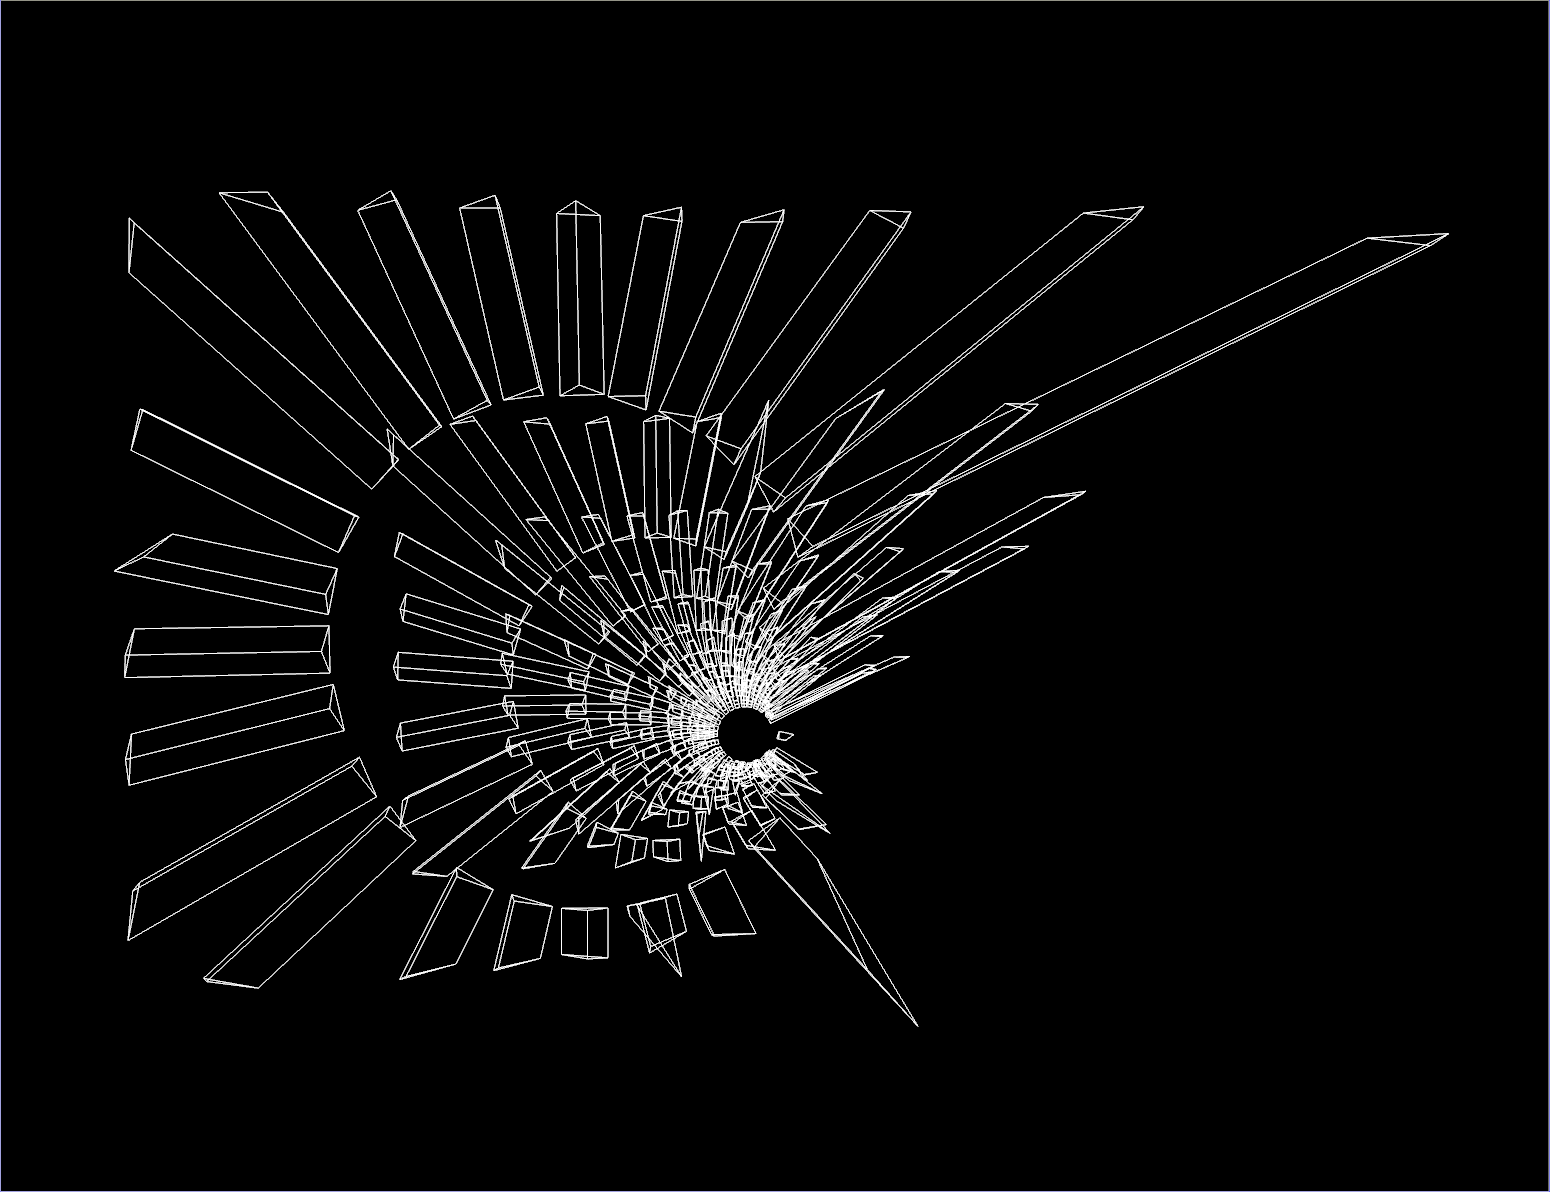
To find these views I spent a long time exploring the scans that I’ve collected and playing with different ways to turn it into a plot in SideFX Houdini. The simplest approach of plotting points from perspective views into the point clouds didn’t appeal to me because I found that without motion or color to give you extra clues about the overall forms the image would just flatten in an unappealing way. So I tried various alternatives, a few of which you can see below:
Once I was seeing images that I liked in Houdini I needed to figure out how to translate them to plots that I could actually execute with the laser. This is a little trickier than you might expect because of a few issues:
When I composed the two plots I had these points in mind.
I’m drawn to the abstract forms that arise from looking at the scans from a birds-eye view. It was a nice coincidence that such a view also simplifies the plotting process. But there was still some work to do. I wanted to have a single line for each sensor revolution “slice”.
In the raw data I had labeled the points with a value that incremented for each revolution of the lidar. So in Houdini I went and for each revolution found the two samples that represented the longest distances when projected down onto the ground plane on each side of the sensor revolution, then joined those with a line segment.
That already looked very similar to what you see in the final plot. But when I tested it there was an exposure issue- in some places the lines bunch up a lot, which led to them being deeply exposed, but in the areas where I moved quickly the isolated lines barely showed up at all after washing. So I computed a speed value for slice’s head pose and put that through a hand-tuned curve to make copies of the lines with very slight random shifts in their end points. That made the isolated lines show up well while preserving the overexposure where the lines bunched up, which I liked.
This one was much more technically ambitious but also in my opinion visually weaker. If you look closely you’ll see that the lines are not tracing out anything that could have come directly from the original scan, which was made by a 2D lidar spinning parallel to the frontal plane of my body. If you look even more closely you might see crudely drawn hands.
I was mulling over why these goofy scans were more satisfying than I expected they would be. When I look at them I’m remembering how I was moving when they were made. It’s that feeling of the entire world being reduced to a thin tunnel ahead of you. Your perception and thinking simplifies and shifts into a very practical mode where what matters is just whether you’ll fit through that gap or if the ground ahead is slippery. Usual day-to-day anxieties lose their urgency in that mode. Most likely everyone is familiar with a version of that phenomena and have their own way to get to it. I think a big part of why I like looking at the scans is because they remind me that my mind can visit that comforting place.
So I wanted to explore the idea that we’re looking at a space formed in my own mind by a shadow of the outside world. Sensations are coming in and I’m doing something to put them together into a structure that my actions can flow through. It’s not the world itself and it’s not wholly a dream. I’m constructing it in real-time by the seat of my pants- filling in details where they matter and without time to dwell on the flaws in the rest.
At least, that’s what I was thinking about while working on this one, but I’m sure not much of that filters through the actual image.
I doodled some hands and populated them on the points of the point cloud. I approximated the surface normals of the scan by looking at the angle between adjacent scan points and used that to orient the hands. Then I constructed a volume from the point cloud and turned it into a surface that I could stick the hands to. It took a lot of experimentation to get a combination of operations that gave an image I liked, unlike the birds-eye plot.
The first time I tried plotting this one it took 8.5 hours. Aside from having some issues I described earlier, a ton of the time was wasted in a tiny zone in the background where a lot of the geometry was. None of that detail came through. And I had sorted the paths with 2-opt because that is built into my Houdini plotting toolkit but here combined with the cyanotype changing over the long process it just resulted in splotchy sections.
To speed things up I needed to reduce the unnecessary detail. And to get a consistent result I needed to control the overall exposure sequence. So I calculated the depth of each point in the camera’s view and randomly deleted them the deeper they were, on a curve that I tweaked by hand. I disabled the path optimization and sorted the geometry based on its camera depth.
Queenie Wu put the show together: Recalculating Route at the All St. Gallery at 119 Hester St. She’s interested in what maps communicate outside of just telling you where things are. I’m very thankful to her for taking interest and reaching out, the whole thing was a joy.
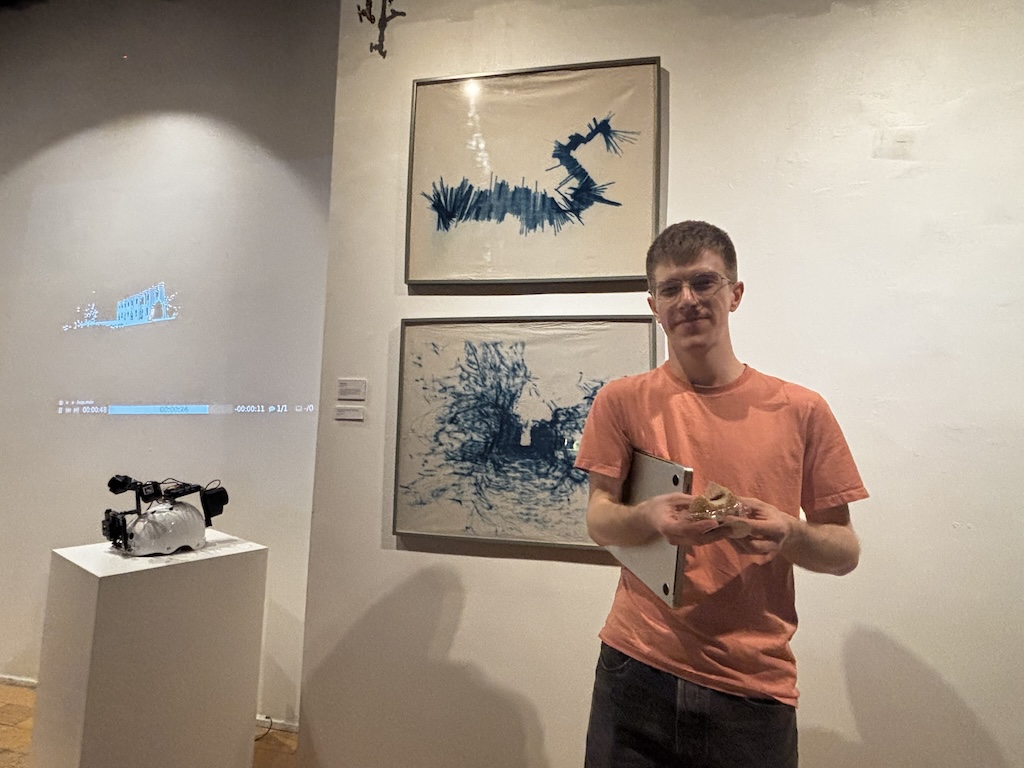
Here I am taking a break eating a snack in front of my work in the gallery:
Near the end of opening night I put on my rollerblades and streamed a scan live into the gallery. I hacked together the system for that in very little time and it was actually the first real world test of it. Surprisingly, it worked almost perfectly! My girlfriend Sally was back in the gallery with me on speakerphone in case anything went wrong. I meandered around the Lower East Side for a while before making my way back to the gallery.
Thank you Omar for the recording!
Some notes about the tech stack: An RPLidar A1 lidar is plugged into a Pixel 6 over USB. I wrote a USB serial driver in Kotlin to pull data from it into a custom Android app. That app uses ARCore to figure out its real world position and orientation (which the phone derives from at least its camera and IMU, maybe GPS and other things too). The app lines up the sensor data and pose and sticks them together into a simple binary format. For my old scans that was just accumulated in a file but for this live scan version it gets batched a little and then uploaded to a server via a series of HTTP requests. The server then broadcast it to web clients connected over WebSockets which rendered it in 3D. The rendering was done with Three.js via React Three Fiber.
I thought the scan turned out really well. I had gone out and around a couple of blocks but when I got back to the gallery it lined up nearly perfectly. Whatever ARCore is doing to make that happen is extremely impressive. It had drifted just a meter or so vertically.
The other artists who participated:
If you want to see laser cyanotypes done better then I recommend checking out Shih Wei Chieh’s work.
Comments
To leave a comment, you need an Are.na account. Comment on this post’s Are.na block and it will appear here.